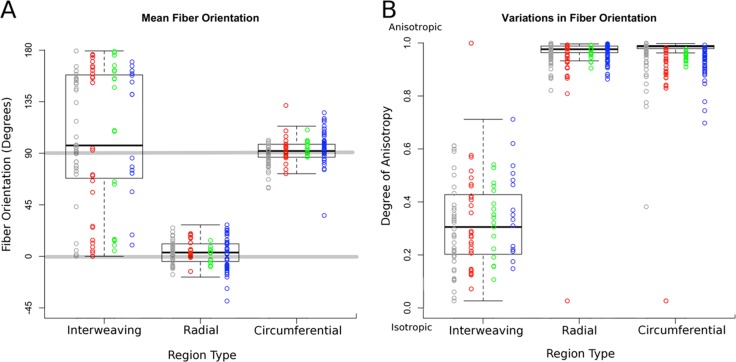
Figure 8.
Box plots of the polar fiber orientations and degree of anisotropy by region type. Orientation was plotted either from −90° to 90° or from 0° to 180° depending on which reference frame gave the least variability. Data acquired from each sheep were plotted in different columns in different colors. Note that for low anisotropy, the value of the mean orientation has little meaning. Results were consistent between contralateral eyes as well as across eyes from different sheep. All eyes used in this analysis were fixed at 5 mm Hg IOP.

