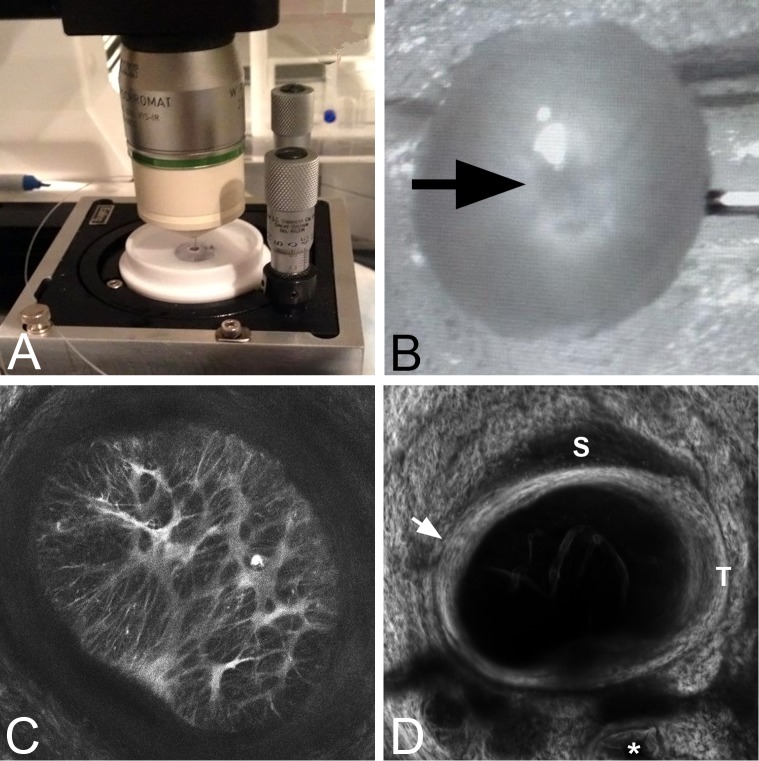
Figure 1.
(A) The inflation test chamber for mouse eyes with two tilt-correcting gears mounted on the imaging stage. (B) Optic nerve head area (arrow) facing the objective lens with the globe cannulated. (C) The maximum-intensity projection of a Z-stack from imaging the astrocytes in the ONH and surrounding sclera (see Supplementary Movie S3 for a video in color through the Z-stack) at 10 mm Hg. (D) Second harmonic generation image of PPS surrounding the ONH at 10 mm Hg. This is a summation of the slices through Z projection image of the PPS. Superior (S) and temporal (T) margins are indicated. The inner scleral contact zone is indicated by the arrow and one of three vascular channels passing through the inferior sclera is marked by an asterisk.

