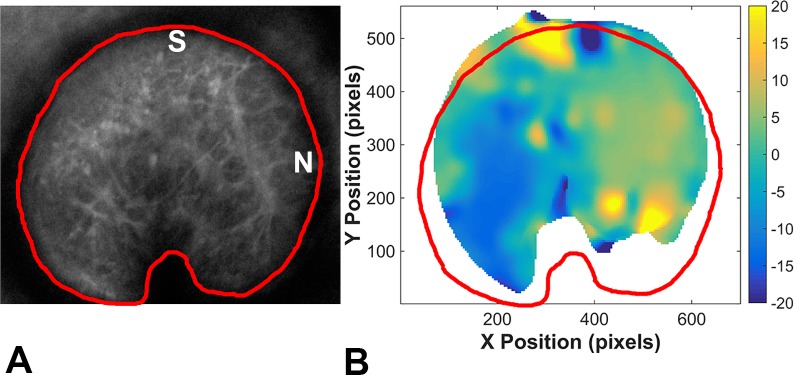
Figure 3.
(A) A 2D Z-averaged intensity projection of a control GLT1/GFP astrocytic lamina at baseline pressure with the optic nerve area outlined in red and oriented with the superior (S) on top and nasal (N) on the right. (B) For a Z-stack imaged at 10 and 30 mm Hg, the area in which DVC correlation was accurate is shown in the colored area, and the degree/direction of displacement indicated by DVC is shown by the color shading in the contour plot. The ONH area is outlined in red. Note that correlation was least likely in the more peripheral ONH.

