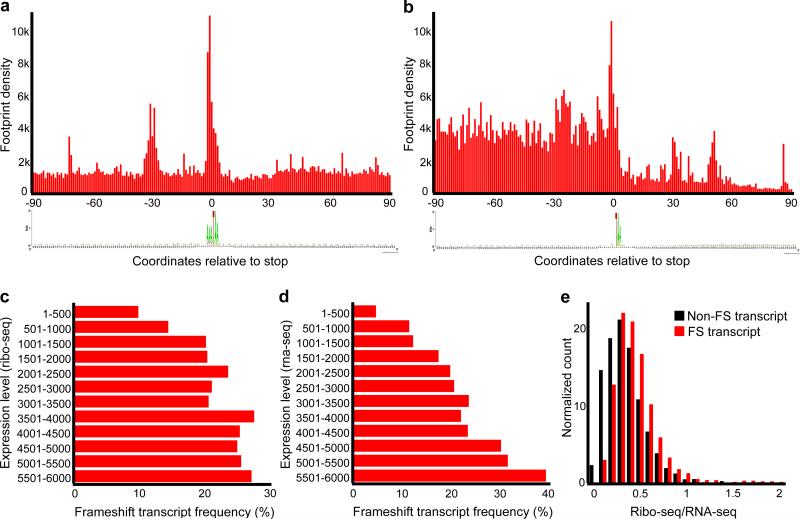
Figure 4. Metagene analysis of ribosome profiling and distribution of frameshifting according to transcript levels.
(a) Metagene analysis of ribosome density in the vicinity of frameshift sites. First nucleotide of a stop codon is shown as zero coordinate. Note that while ribosome density upstream and downstream of frameshift sites is similar, there is a peak of density at the frameshift sites and this is accompanied by another peak 30 nucleotides upstream. A sequence logo below represents the information content of sequences used for metagene alignment. The sequence AAA_TAA is predominant, and there are no other position-specific signals associated with frameshifting. (b) Metagene analysis of ribosome density in the vicinity of translation termination sites. A drop in ribosome density is evident downstream of stop codons. A sequence logo representing information content in the sequences used for metagene analysis is given below. Only mRNAs with 3’UTRs longer than 90 nts (polyA is not included) were used. (c) Frequency of transcripts with the sites of ribosomal frameshifting (axis X) versus the transcripts ranked based on the levels of protein synthesis (Ribo-seq density), axis Y. (d) Similar to (c), but ranking is based on RNA levels (RNA-seq density). (e) Distribution of transcripts with different Ribo-seq to RNA-seq ratios containing frameshift sites (red) and not containing frameshift sites (black).

