
Extended Data Figure 9.
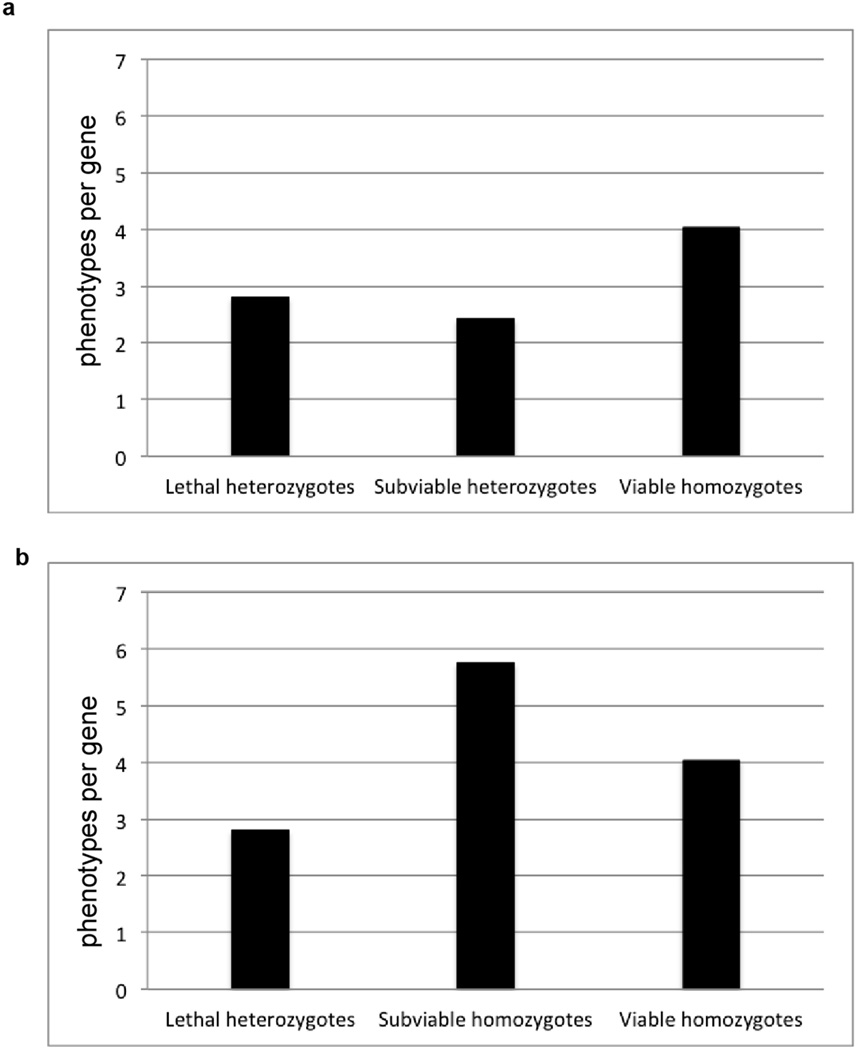
Phenotype hit rates from the adult phenotyping pipeline for lethal, subviable and viable lines. a, Comparison of hit rates between lethal and subviable line heterozygotes versus viable line homozygotes. b, Homozygous subviable cohorts show a dramatically higher hit rate versus lethal line heterozygotes and viable line homozygotes.