
Figure 5. Essential genes are enriched in human disease genes and intolerant to genetic variation.
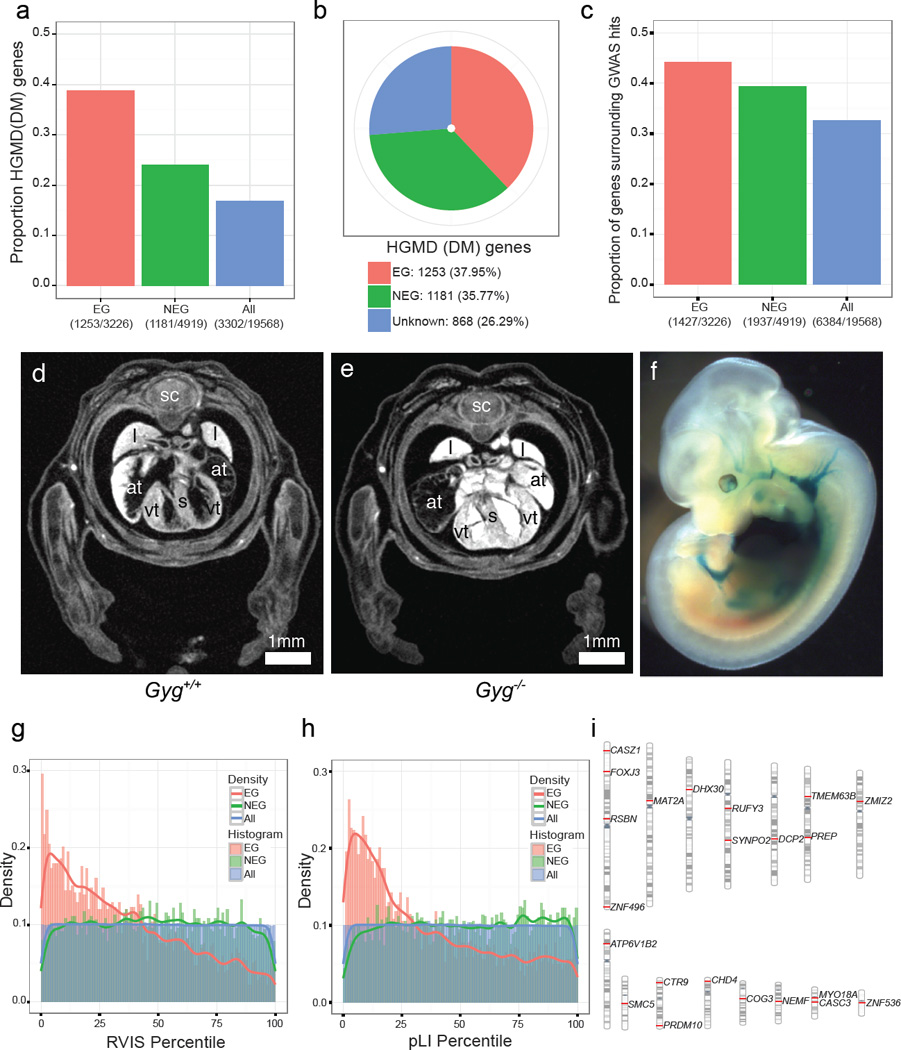
a,. The fractions indicate the number of HGMD disease genes (n=3302) among 3326 Essential genes (EG in red); 4919 Nonessential genes (NEG in green) and 19568 protein-coding genes (ALL in blue). Fisher’s exact test for enrichment: EG vs. NEG (odds ratio=2.00, p=7.80e-46), EG vs. ALL (odds ratio=3.13, p=2.42e-160), NEG vs. ALL (odds ratio=1.56, p=1.83e-29). b, Essentiality status of 3302 HGMD disease genes. c. The fractions indicate the number of genes encompassing or neighbouring GWAS hits33 (n=6384) divided by essentiality status. Fisher’s exact test for enrichment: EG vs. NEG (odds ratio=1.16, p=0.0015), EG vs. ALL (odds ratio=1.56, p=5.80e-31), NEG vs. ALL (odds ratio=1.35, p=1.18e-19). d,e, Gyg null embryos at E15.5 show enlarged atria and a thickened ventricular wall versus controls. f, LacZ expression for Gyg was seen in the heart and vascular system (homozygote shown).. sc=spinal cord; l=lung; s=septum; at=atrium; vt=ventricle. (n = 5 mutants) g, Distribution of percentiles of the Residual Variation Intolerance Score (RVIS) across three classes of genes: EG, NEG and ALL Wilcoxon rank sum test: EG vs. NEG (p<2.2e-16), EG vs. ALL (p<2.2e-16), NEG vs. ALL (p=0.579). h, Distribution of percentiles of the probability of being loss-of-function intolerant (pLI) across three classes of genes: EG, NEG and ALL. Wilcoxon rank sum test: EG vs. NEG (p<2.2e-16), EG vs. ALL (p<2.2e-16), ALL vs. NEG (p= 4.15e-05). i, Chromosomal distribution of 22 human orthologs of RVIS and pLI intolerant essential genes that are not currently included in the catalogues of Mendelian disease genes.