
Extended Data Figure 3.
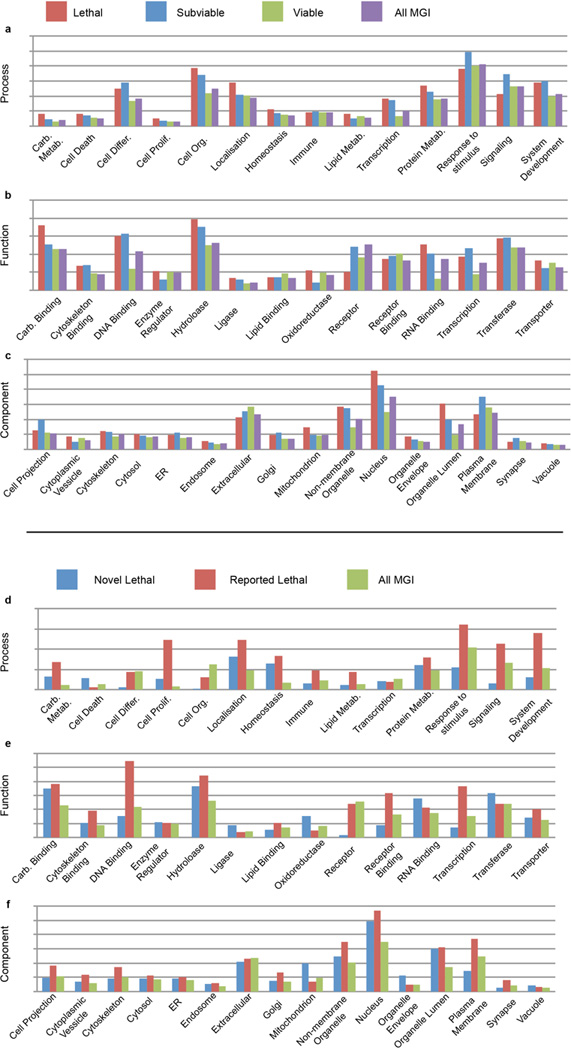
Multiple GOSlim categories show enrichment for lethal and subviable genes versus viable genes from the IMPC dataset. The analysis was performed for GO Process (a), GO Function (b) and GO Component (c) categories. X-axis is the proportion of genes in each class that are annotated for the GOSlim group for each category. d–f, Novel lethal IMPC genes, previously reported IMPC genes and all MGI genes were subject to the same analysis, showing the large effect analysis and characterization of lethal genes has on GO analysis.