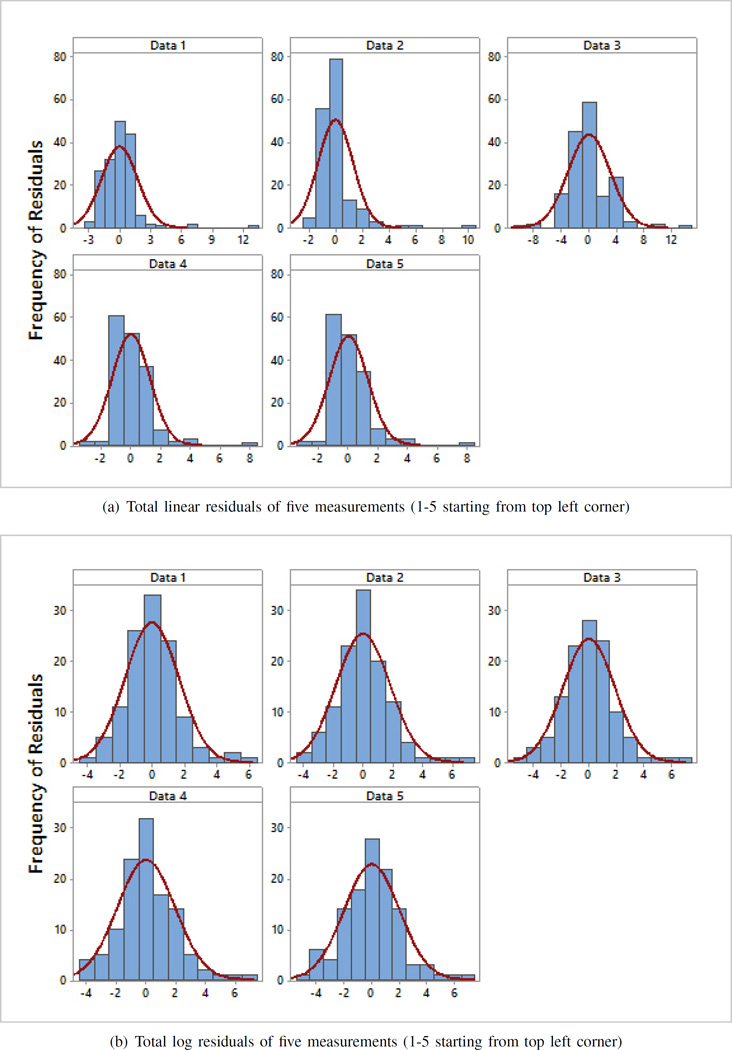
Fig. 5.
Histograms of residuals for five measurements using a) linear and b) log scale. The red envelope is the distribution curve in each plot. These results demonstrate that the residuals from the log scale measurements are more normally distributed than the residuals from the linear scale measurements. This indicate that the error in logarithmic case is random and independent.

