
Figure 2.
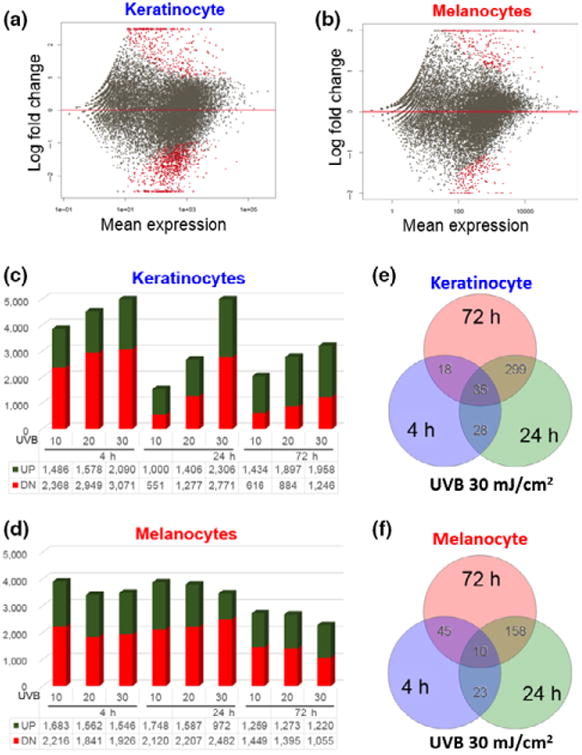
UVB-induced transcriptomic changes in keratinocytes and melanocytes. (a and b) Plots illustrating UVB-induced differential transcriptomic changes between keratinocytes and melanocytes. Each plot was generated using the average gene expression changes in response to three different UVB doses (10, 20 and 30 mJ/cm2) at 4 h after exposure. Each red dot indicates a differentially expressed gene between UVB-irradiated cells and non-irradiated control cells (FC cut-off set at 2 and P < 0.05). Red dots above the middle red line represent genes that were induced by UVB, while red dots below the middle red line represent genes that were repressed by UVB; (c and d) Time- and dose-dependent UVB-induced changes in global gene expression in keratinocytes and melanocytes; (e and f) Venn diagram illustrating the overlaps in the number of UVB-responsive genes at three different time points (4, 24 and 72 h) following 30 mJ/cm2 of UVB radiation.