
Figure 1.
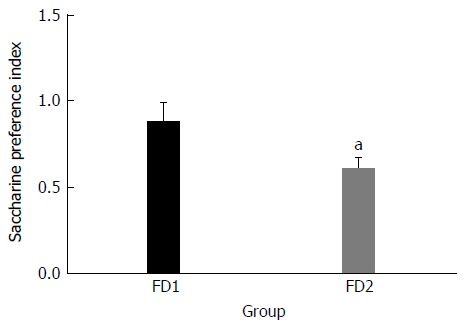
Saccharine preference index of the normal group (FD1) and the model group (FD2). The data are presented as mean ± SE. aP < 0.01 vs the normal group.
Official websites use .gov
A
.gov website belongs to an official
government organization in the United States.
Secure .gov websites use HTTPS
A lock (
) or https:// means you've safely
connected to the .gov website. Share sensitive
information only on official, secure websites.
Saccharine preference index of the normal group (FD1) and the model group (FD2). The data are presented as mean ± SE. aP < 0.01 vs the normal group.