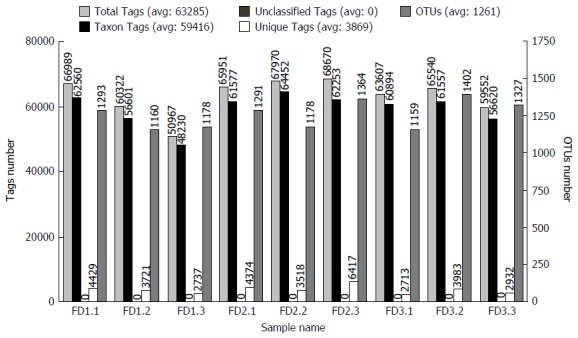
Figure 3.

Statistical graph of Tags and Operational Taxonomic Unit clustering. Normal group: FD (1.1-1.3); Model group: FD (2.1-2.3); Xiaoyaosan group: FD (3.1-3.3). Total Tags: Effective Tags; Unique Tags: Uneffective Tags; Taxon Tags: Annotated Tags for OTUs; Unclassified Tags: Unannotated Tags. OTUs: Operational Taxonomic Units; FD: Functional dyspepsia.
