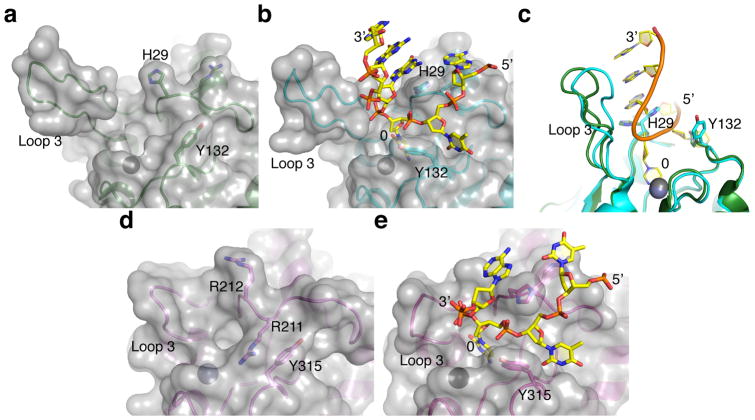
Figure 4. Comparison between apo and ssDNA-bound A3A and A3B structures.
(a–b) Molecular surface of A3A around the active site in the DNA-free (panel a, pdb 4XXO) and ssDNA-bound (panel b, this study) states, showing re-orientation of the side chains of His29 and Tyr132. (c) A superposition of the two conformations in panels a and b highlighting the repositioning of His29 and Tyr132 as well as shifting of loop 3 toward the bound ssDNA. (d–e) Molecular surface of A3Bctd* around the active site in the DNA-free (panel d, pdb 5CQH) and ssDNA-bound (panel e, this study) states showing the large transition that is likely to occur between the closed (unbound) and open (ssDNA-bound) conformations.

