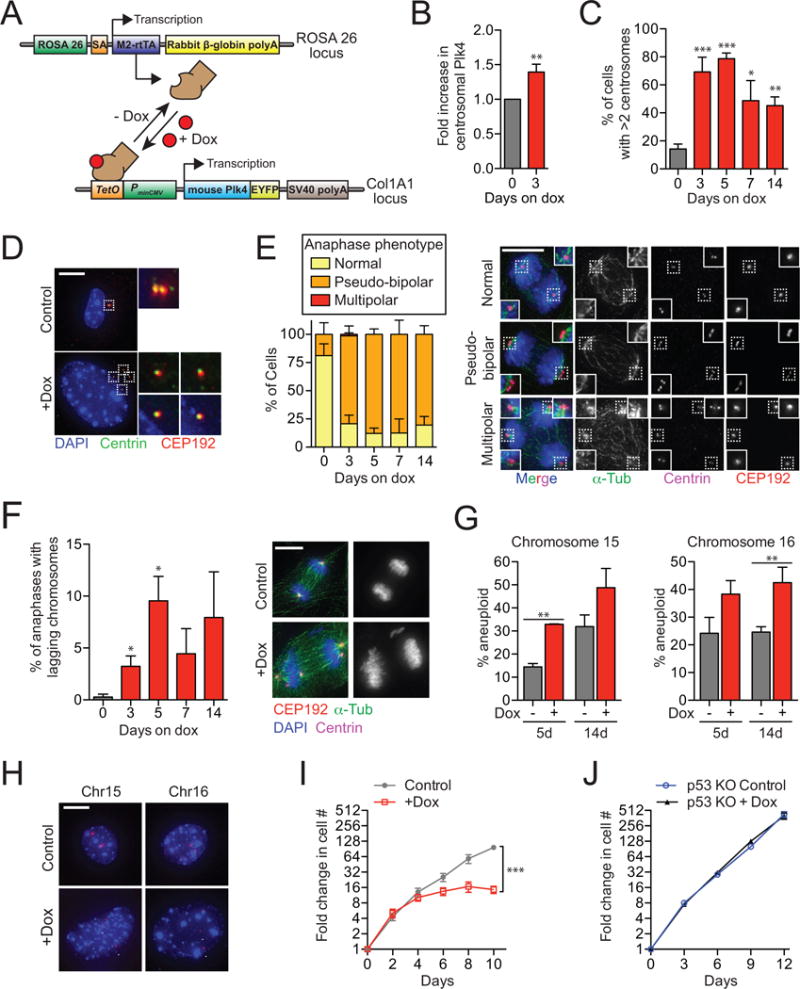
Figure 1. related to Figure S1. A modest increase in Plk4 promotes centrosome amplification and aneuploidy in vitro.

(A) System used for doxycycline-inducible expression of Plk4.
(B) Quantification of the level of centrosomal Plk4 in Plk4Dox MEFs. N = 3, >150 centrosomes per experiment.
(C) Quantification of the level of centrosome amplification in Plk4Dox MEFs. N = 3, >150 cells per experiment.
(D) Immunofluorescent images of centrosomes in Plk4Dox MEFs.
(E) Quantification of anaphase phenotypes in Plk4Dox MEFs. N = 3, >150 cells per experiment.
(F) Quantification of anaphase lagging chromosomes in Plk4Dox MEFs. N = 3, >150 cells per experiment.
(G) Quantification of the fraction of cells having <2 or >2 copies of chromosome 15 or 16. N = 3, >150 cells per experiment.
(H) Immunofluorescent images of FISH performed on Plk4Dox MEFs using probes against chromosome 15 and 16. Arrowheads mark each copy of Chr15 or Chr16.
(I) Graph showing the fold increase in cell number for Plk4Dox MEFs. N = 3, performed in triplicate.
(J) Graph showing the fold increase in cell number for Plk4Dox MEFs expressing SpCas9 and an sgRNA against p53. N = 3, performed in triplicate.
All data represent the means ±SEM. *P < 0.05, **P < 0.01 and ***P < 0.001; two-tailed Student’s t-test. Scale bars represent 10 μm.
