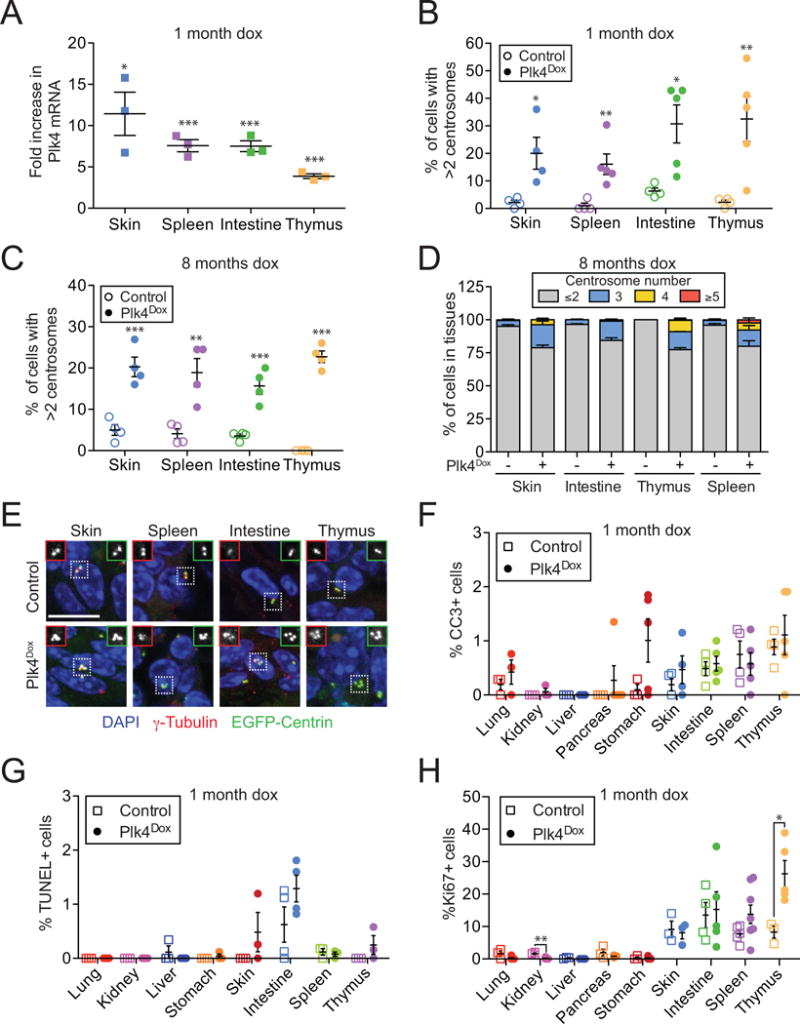
Figure 2. related to Figure S2 and S3. Increased Plk4 levels promote chronic centrosome amplification in multiple tissues.

(A) Fold increase in Plk4 mRNA in tissues from Plk4Dox mice treated with doxycycline for 1 month. N = 3, performed in triplicate.
(B and C) Quantification of the level of centrosome amplification in tissues from Plk4Dox mice treated with doxycycline for 1 or 8 month. N ≥ 4.
(D) Quantification of centrosome number in tissues from Plk4Dox mice treated with doxycycline for 8 months. N = 4.
(E) Representative images of centrosomes in tissues from doxycycline treated Plk4Dox or control animals.
(F–H) Quantification of the fraction of cleaved caspase 3, TUNEL, or Ki67 positive cells in tissues from Plk4Dox mice treated with doxycycline for 1 month. Data are means ±SEM (N = ≥4).
All data represent the means ±SEM. *P < 0.05, **P < 0.01 and ***P < 0.001; two-tailed Student’s t-test. Scale bars represent 10 μm.
