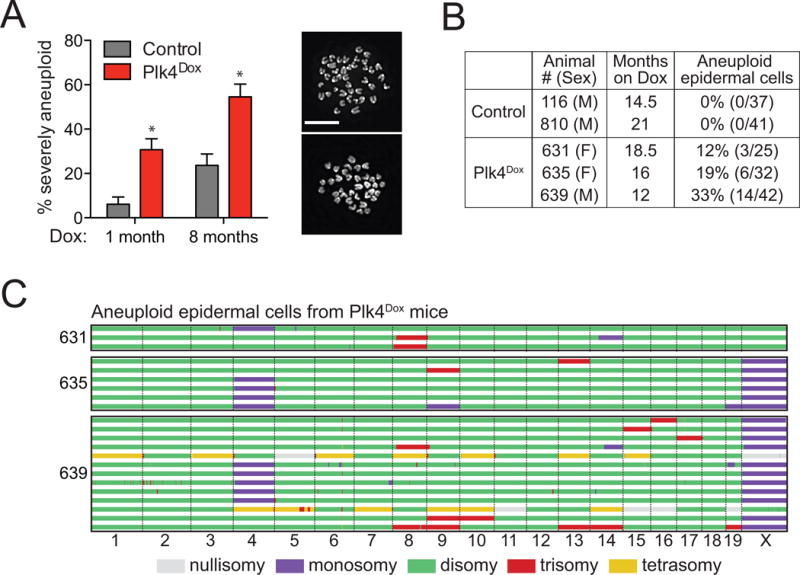
Figure 3. related to Figure S4. Centrosome amplification drives aneuploidy in vivo.

(A) Proportion of severely aneuploid (4N ± > 2 chromosomes) splenocytes from control and Plk4Dox mice treated with doxycycline for 1 or 8 months. N = 3, > 120 cells per experiment.
(B) Table shows the fraction of aneuploid cells determined by single cell sequencing of epidermal cells from doxycycline-treated control or Plk4Dox mice.
(C) Genome-wide copy number plots of aneuploid single cells sequenced from the epidermis of 3 Plk4Dox mice treated with doxycycline for 12–18.5 months. Individual cells are represented in rows with copy number states indicated in colors.
All data represent the means ±SEM. *P < 0.05; two-tailed Student’s t-test. Scale bars represent 10 μm.
