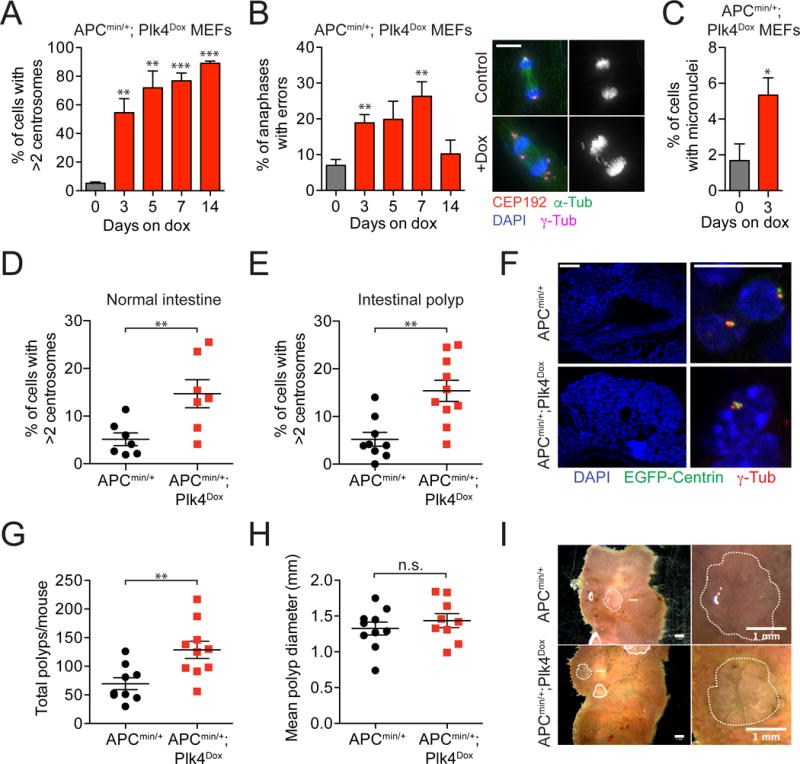
Figure 4. related to Figure S4. Centrosome amplification promotes tumor initiation.

(A) Quantification of the level of centrosome amplification in APCMin/+; Plk4Dox MEFs. N = 3, >150 cells per experiment.
(B) Quantification of anaphase lagging chromosomes in APCMin/+; Plk4Dox MEFs. N = 3, >84 cells per experiment. Scale bar represents 10 μm.
(C) Frequency of micronuclei observed in APCMin/+; Plk4Dox MEFs. N = 3, >50 cells per experiment.
(D and E) APCMin and APCMin/+; Plk4Dox mice were treated with doxycycline from 10 days of age and sacrificed at 90 days old. Quantification shows the level of centrosome amplification in the intestines or intestinal polyps of APCMin and APCMin/+; Plk4Dox mice. N = 3, >150 cells per experiment.
(F) (Left) Immunofluorescence staining of an intestinal polyp and (Right) a magnified view of centrosomes in this tumor. Scale bars represent 200 μm (left) and 10μm (right).
(G and H) Quantification of tumor number (G) or size (H) in 90 day old APCMin and APCMin/+; Plk4Dox mice.
(I) Images show intestinal polyps in an APCMin and APCMin/+; Plk4Dox mouse.
All data represent the means ±SEM. *P < 0.05, **P < 0.01, ***P < 0.001 and NS (not significant) indicates P > 0.05; two-tailed Student’s t-test.
