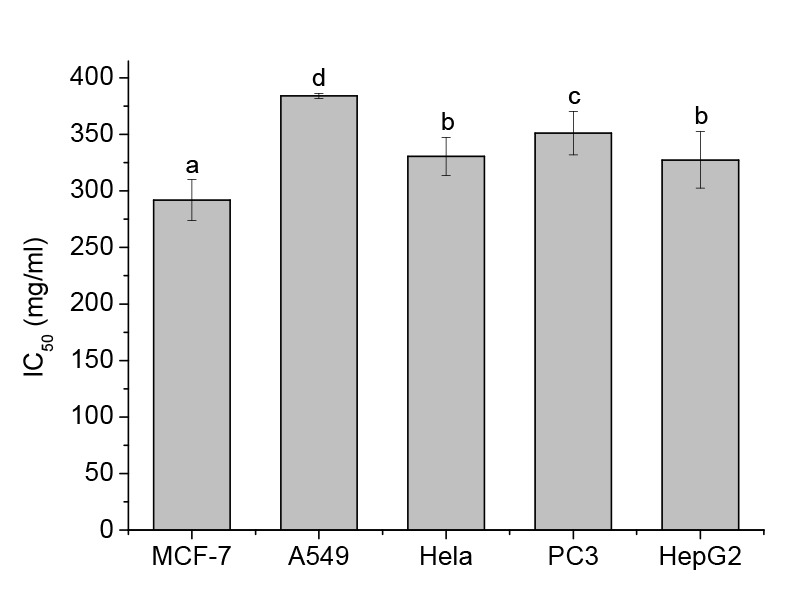
Fig. 1.

IC50 values of GTPs against the viabilities of different cells
MCF-7, A549, Hela, PC3, and HepG2 cells were treated for 24 h with medium or GTPs at different concentrations. Data are expressed as mean±SD, with n=3. Different letters above the columns indicate significant differences (P<0.05)
