
Fig. 1.
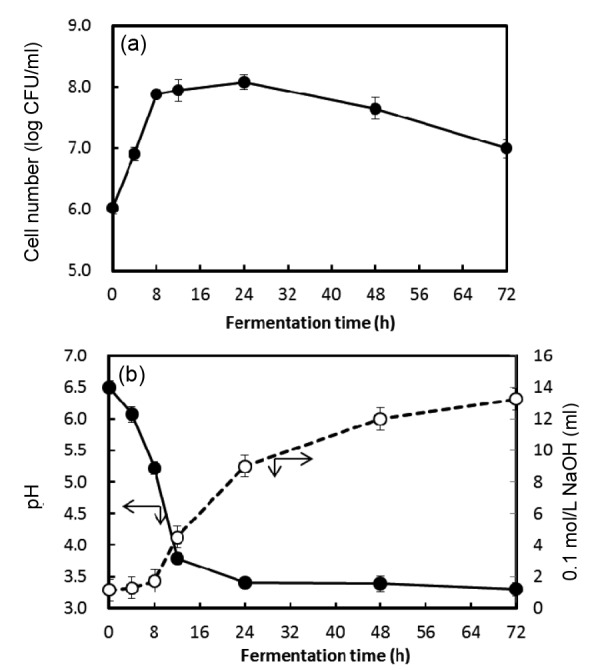
Changes of pH and total acidity during the fermentation of chamomile extract at 30 °C for 72 h
(a) Growth curve;. (b) pH (●) and total acidity (○). Data are represented as mean±standard deviation (SD) in triplicate
Official websites use .gov
A
.gov website belongs to an official
government organization in the United States.
Secure .gov websites use HTTPS
A lock (
) or https:// means you've safely
connected to the .gov website. Share sensitive
information only on official, secure websites.
Changes of pH and total acidity during the fermentation of chamomile extract at 30 °C for 72 h
(a) Growth curve;. (b) pH (●) and total acidity (○). Data are represented as mean±standard deviation (SD) in triplicate