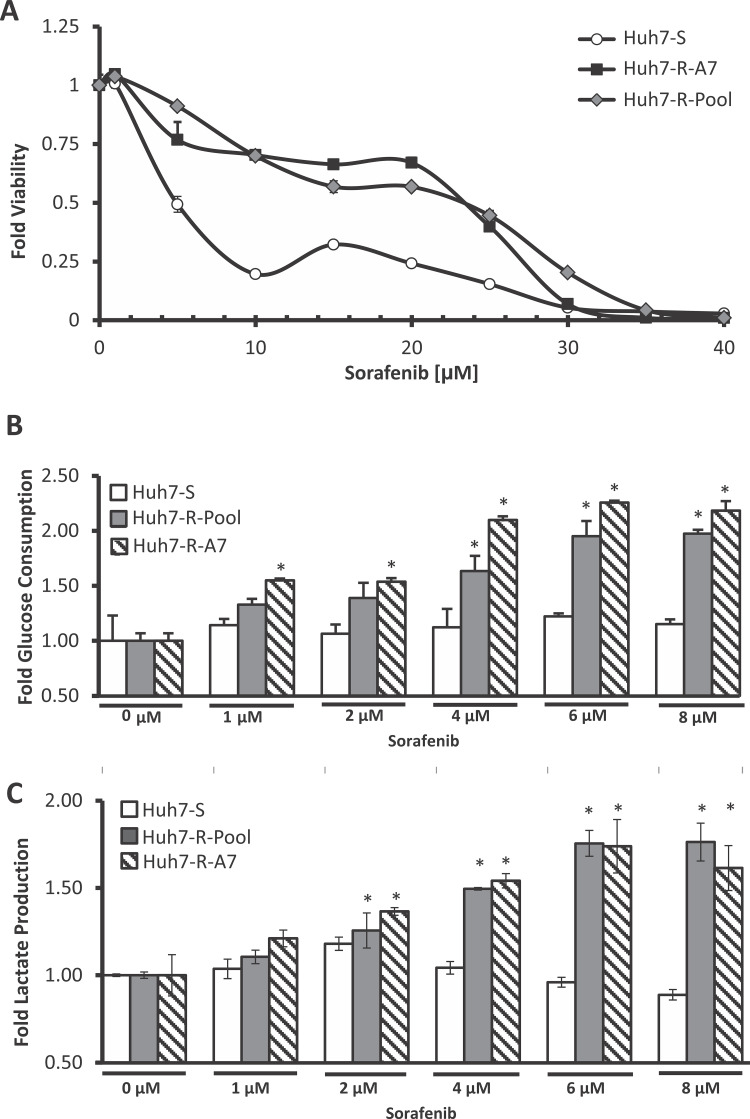
Figure 1.
Establishment and characterization of sorafenib-resistant HCC cell lines. (A) Viability assay of Huh7-S, Huh7-R-Pool, and Huh7-R-A7 cells. Cells were treated with various concentrations of sorafenib for 48 h. Error bars represent the standard deviation of two biological replicates. (B) Glucose consumption and (C) lactate production of Huh7-S, Huh7-R-Pool, and Huh7-R-A7 cells. The error bars represent the standard deviation of two biological replicates. *p < 0.05 (t-test) compared to 0 μM treated cells of the corresponding cell line.

