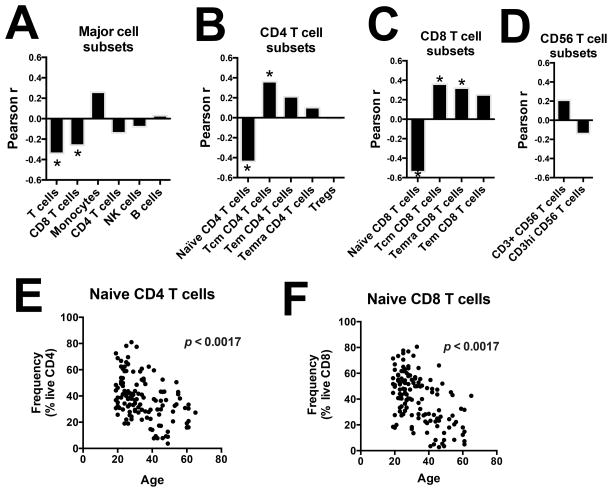
Figure 5. Demographic correlates of biological variability of lymphocyte populations frequencies.
Cell frequencies were determined with the 10-color flow cytometry panel and centralized manual gating on cryopreserved PBMC samples obtained from 132 human subjects. Pearson correlation coefficient between age and the frequency of (A) major cell subsets, (B) CD4 T cell subsets, (C) CD8 T cell subsets and (D) CD56 T cell subsets, (E) naïve CD4 T cells and (F) naïve CD8 T cells. P values were corrected for multiple testing. * p < 0.05.

