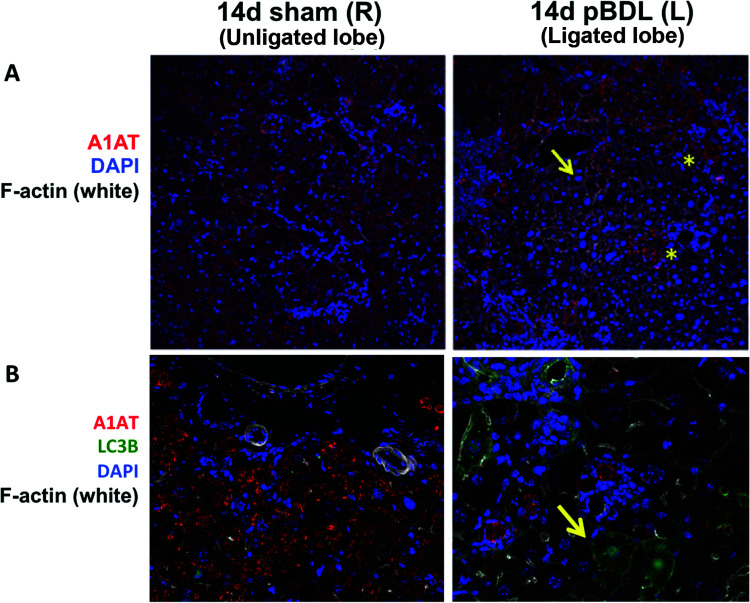
Figure 7.
Relationship of ATZ globule clearance to autophagy in partial bile duct ligation. (A) Confocal immunofluorescence microscopy showing the cleared areas of red ATZ globules in pBDL lobe (right, arrow) compared to unligated control lobe (left). *Residual GC hepatocytes intermixed within areas of ductal proliferation (magnification: 100×). (B) Increased LC3B staining (green, right, arrow) in GD hepatocytes in the ligated pBDL lobe (magnification: 200×).

