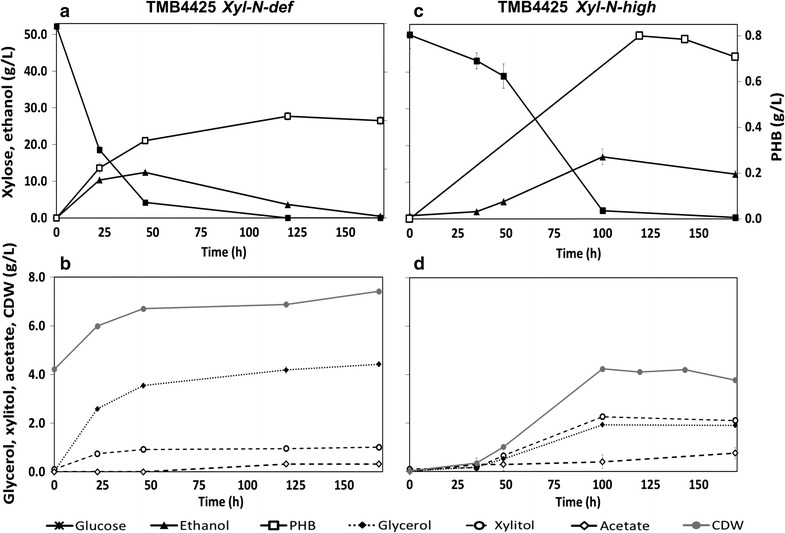
Fig. 4.

Metabolite profiles of S. cerevisiae TMB4425 during 170 h of cultivation under anaerobic conditions in xylose defined medium. Xylose and ethanol profiles are shown under the absence (Fig. 2a) or the excess of nitrogen (Fig. 2c). Figures 2b, d correspond to the N-def and N-high experiments, respectively, and show the variation of glycerol, xylitol, acetate and cell dry weight (CDW) levels. Each set of graphs (a and b for N-def; c and d for N-high) corresponds to one biological replicate representative of the two that were performed
