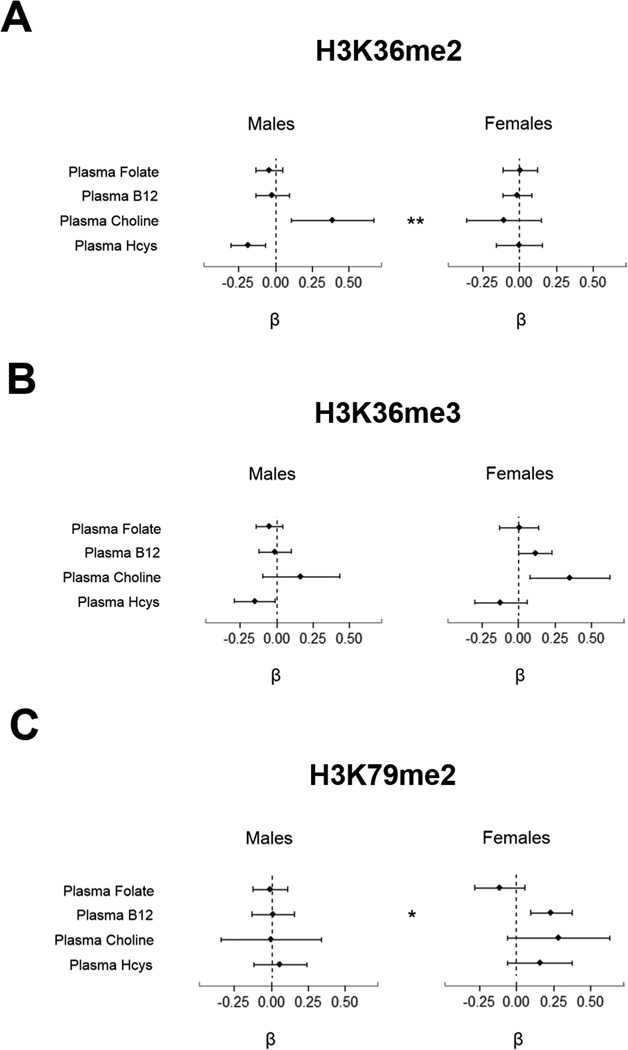
Figure 2. Sex-Specific Associations between OCM Indices and PTHMs in FACT Participants.
Estimated regression coefficients and 95% confidence intervals for associations between each OCM index and (A) H3K36me2, (B) H3K36me3, and (C) H3K79me2 are shown separately by sex. The dashed line represents the null (β = 0). Associations with confidence intervals that do not cross the null are statistically significant (P < 0.05). Asterisks (*P < 0.05, **P < 0.01) indicate sex differences with p-values calculated from the Wald test. OCM indices were natural log-transformed and were included simultaneously in models. Models were adjusted for age, education, TV ownership, and ln-bSe. Analyses for H3K36me3 and H3K79me2 in men were additionally adjusted for cigarette smoking status. H3K36me2 was inverse-transformed and was modeled using a generalized linear model with an inverse-link function. H3K36me3 and H3K79me2 were natural log transformed and were modeled using linear models. Sample sizes for the main analyses were as follows H3K36me2: n = 159 for men, n = 159 for women; H3K36me3: n = 154 for men, n = 152 for women; H3K79me2: n = 162 for men, n = 159 for women.

