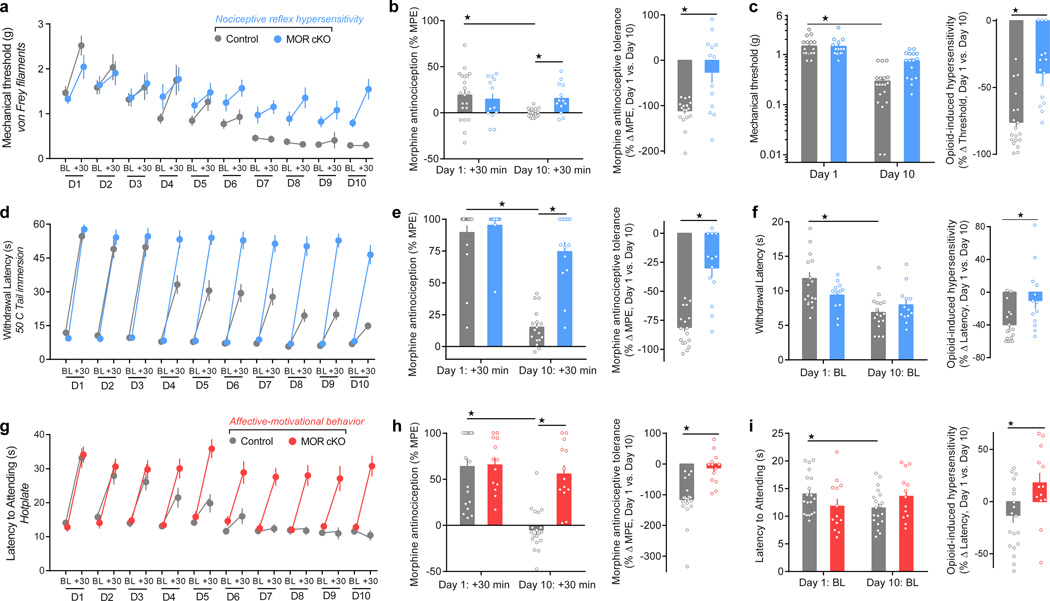
Figure 3. Conditional deletion of MOR from TRPV1 nociceptors prevents the onset of morphine antinociceptive tolerance and OIH.
(a,d,g) Daily nociceptive behavior and opioid antinociception throughout a 10 day chronic morphine schedule (10 mg/kg, subcutaneous, once daily). Nociceptive behavior (pre-morphine BL timepoints only): von Frey: F1, 30 = 9.863, P = 0.004; tail immersion: F1, 30 = 0.7311; hotplate: F1, 30 = 0.2581, P = 0.0615. Antinociception (post-morphine +30 min timepoints only): von Frey: F1, 30 = 4.812, P = 0.0367; tail immersion: F1, 30 = 19.74, P < 0.0001; hotplate: F1, 30 = 17.23, P = 0.0004. (b,e,h) Antinociceptive tolerance: (left panels) Maximal possible effect (MPE) for morphine antinociception from the first administration (Day 1: +30 min) compared to the last administration (Day 10: +30 min) (von Frey: F1, 30 = 7.621, P = 0.0097; tail immersion: F1, 30 = 28.27, P < 0.0001; hotplate: F1, 30 = 12.27, P = 0.0015), and (right panels) the percent change for each subject. (c,f,i) OIH: (left panels) Percent change in the pre-morphine baseline nociceptive behaviors prior to the first administration (Day 1: BL) compared to the last (Day 10: BL) (von Frey: F1, 30 = 6.13, P < 0.001; tail immersion: F1, 30 = 23.08, P < 0.0001; hotplate: F1, 30 = 5.163, P = 0.0304), and (right panels) the percent change for each subject. Control, n = 19; MOR cKO, n = 13. BL = baseline. Student’s t Test, two-tailed (right panels of b,c,e,f,h,i). Repeated Measures Two-way ANOVA + Bonferroni (a,d,g and left panels of b,c,e,f,h,i). ★ P < 0.05. Error bars are mean ± SEM. Overlaid points are individual animal scores. BL = baseline.

