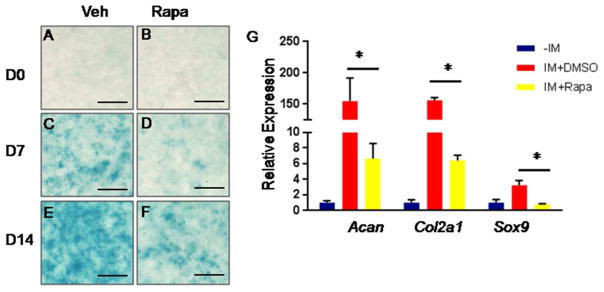
Figure 4. Pharmacological inhibition of mTORC1 signaling attenuated chondrogenic differentiation of ATDC5 cells.
(A–F) Alcian blue staining of ATDC5 cells before (A, B) or after 7 (C, D) and 14 (E, F) days of chondrogenic differentitaton in the absence (Veh, A, C, E) or the presence of 20 nM rapamycin (Rapa, B, D, F). Scale bar: 1 mm. (G) qPCR analyses of Acan, Col2a1, and Sox9 expression in ATDC5 cells before chondrogenic induction (−IM) or after 7 days of culture in chondrogenic media (IM) supplemented without (IM+DMSO) or with 20 nM rapamycin (IM+Rapa). n=3, *: P<0.05.

