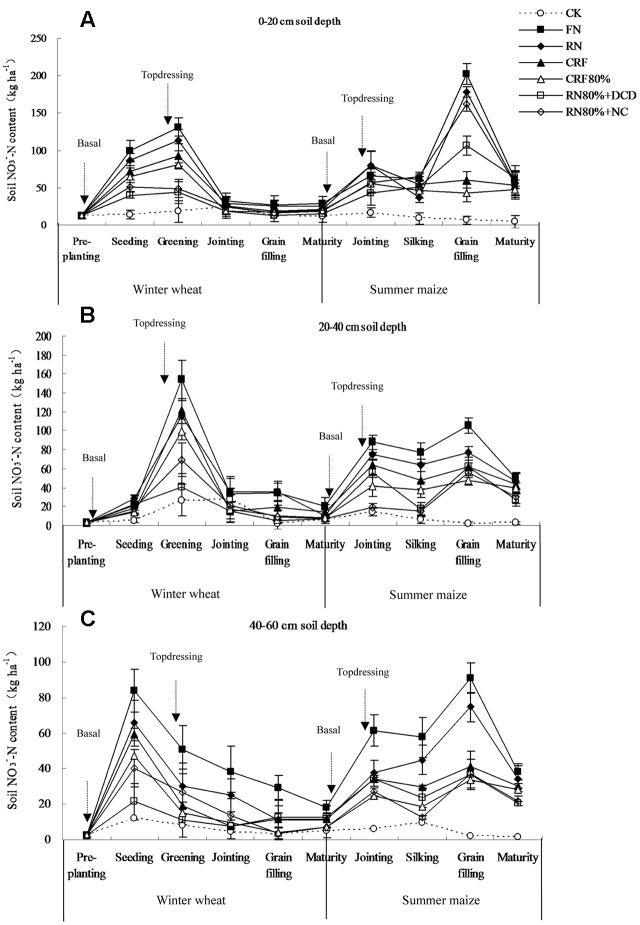
FIGURE 1.
Temporal and spatial variations of soil NO3--N content with different N control measures. (A) 0–20 cm soil depth, (B) 20–40 cm soil depth, and (C) 40–60 cm soil depth. The bars denote standard deviation of the three replicates. Treatments of CK, FN, RN, CRF, CRF80%, RN80%+DCD, and RN80%+NC represent the corresponding treatments as described in Table 1. Basal and topdressing are the times of fertilization. Treatments of FN, RN, RN80%+DCD and RN80%+NC are topdressed, while CK, CRF, and CRF80% not.

