FIGURE 4.

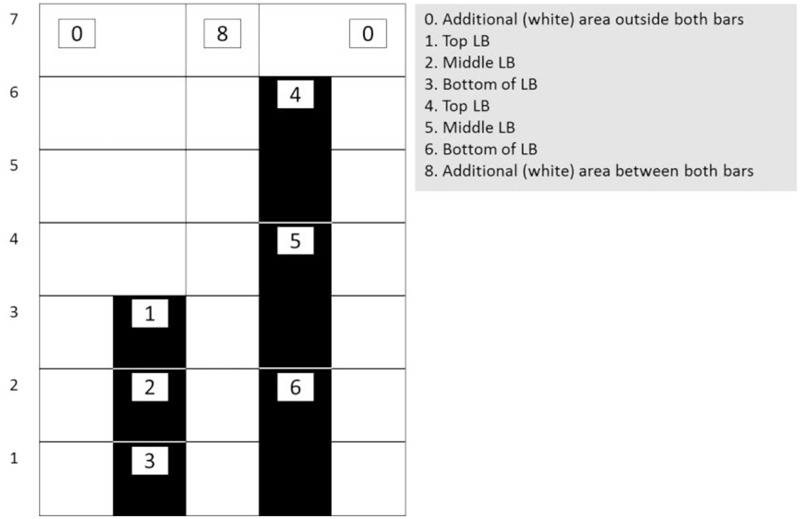
Schematic representation of the allocation of the eight (dynamic) areas of interest (AoIs) used in current study. The AoIs on the bars were slightly larger than the bars: 40 pixels on both sides and 40 pixels on top.

Schematic representation of the allocation of the eight (dynamic) areas of interest (AoIs) used in current study. The AoIs on the bars were slightly larger than the bars: 40 pixels on both sides and 40 pixels on top.