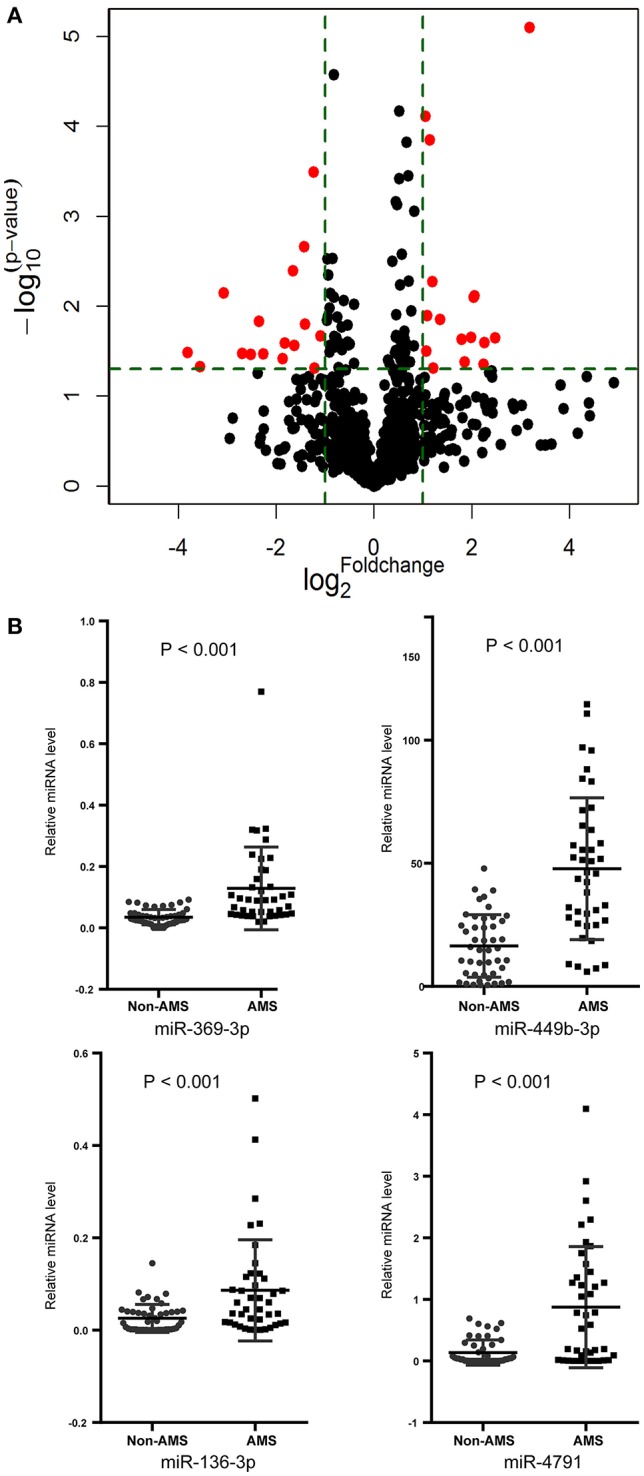
Figure 2.

Circulating microRNAs expression profile was different between acute mountain sickness (AMS) and non-acute mountain sickness (Non-AMS) groups. (A) Comparisons of all microRNAs in microarray analysis of RNA isolated from plasma of AMS and Non-AMS groups. The volcano plot displays the relationship between fold-change and significance using a scatter plot view. The red points in the plot represent the differentially expressed microRNAs with statistical significance. (B) Results of the quantitative reverse-transcription polymerase chain reaction of the miR-369-3p, miR-449b-3p, miR-136-3p, and miR-4791 expression (AMS, n = 41; Non-AMS, n = 46).
