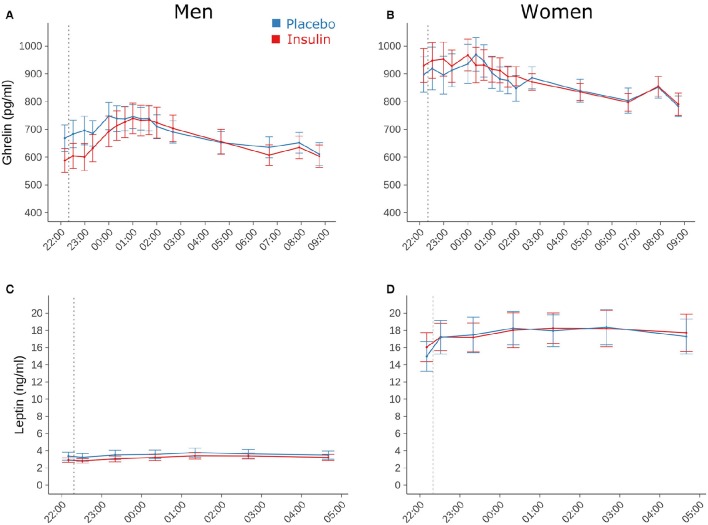
Figure 3.
Blood parameters. Mean ± SEM concentrations of (A,B) plasma total ghrelin and (C,D) serum leptin measured in young male (n = 16; left panels) and female participants (n = 16; right panels) who were intranasally administered insulin (160 IU; red lines) or placebo (blue lines) at 2220 h (dotted line). Note that leptin concentrations were determined only until 0440 h in the morning.

