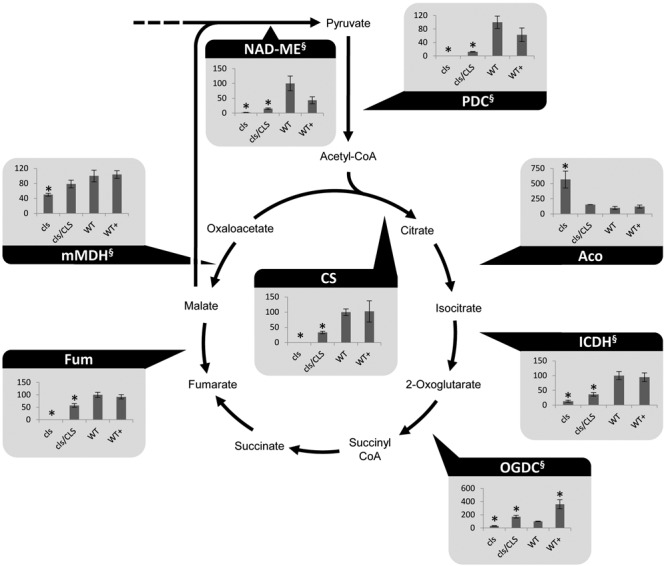
FIGURE 2.

Photometrically assayed enzymatic capacities of TCA cycle enzymes of three biological replicates of mutant and WT lines. Arrows indicate the directions of the tested enzymatic reactions. Asterisks indicate p < 0.05 compared to WT. Capacities are given as percentages of the corresponding WT values. Of each line three biological replicates were tested, error bars indicate standard deviation. Aco, aconitase; Fum, fumarase; ICDH, isocitrate dehydrogenase; mMDH, mitochondrial malate dehydrogenase; NAD-ME, NAD-malic enzyme; OGDC, 2-oxoglutarate dehydrogenase; PDC, pyruvate dehydrogenase complex; SDH, succinate dehydrogenase complex. § marks NADH-producing reactions.
