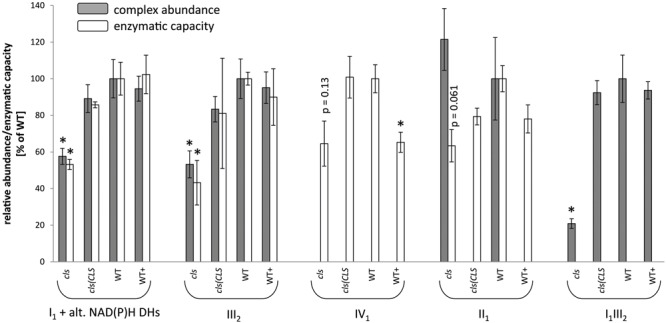
FIGURE 5.

Relative abundances (gray bars) and enzymatic capacities (white bars) of respiratory complexes I1 [including alternative NAD(P)H dehydrogenases], II1, III2, IV1, V1 and the I1III2 supercomplex. For enzymatic capacities, electron transfer rates from NADH to ferricyanide (I1 and potentially I1III2), succinate to DCIP (II1), ubiquinol to oxidized cytochrome C (III2 and potentially I1III2), and reduced cytochrome c to O2 (IV1) were analyzed photometrically. Abundances of protein complexes and the supercomplex were deduced densitometrically from 1D BN gels (I1, III2, V1 and I1III2) or from 2D BN/SDS gels (II1). All values are shown as arbitrary units of the mean of the respective WT rates. Error bars for enzymatic capacities indicate standard error of mean of three biological replicates consisting of three technical replicates each. Error bars for protein complex abundance indicate standard error of four biological replicates (see Figure 4). Asterisks indicate p < 0.05 when compared to WT.
