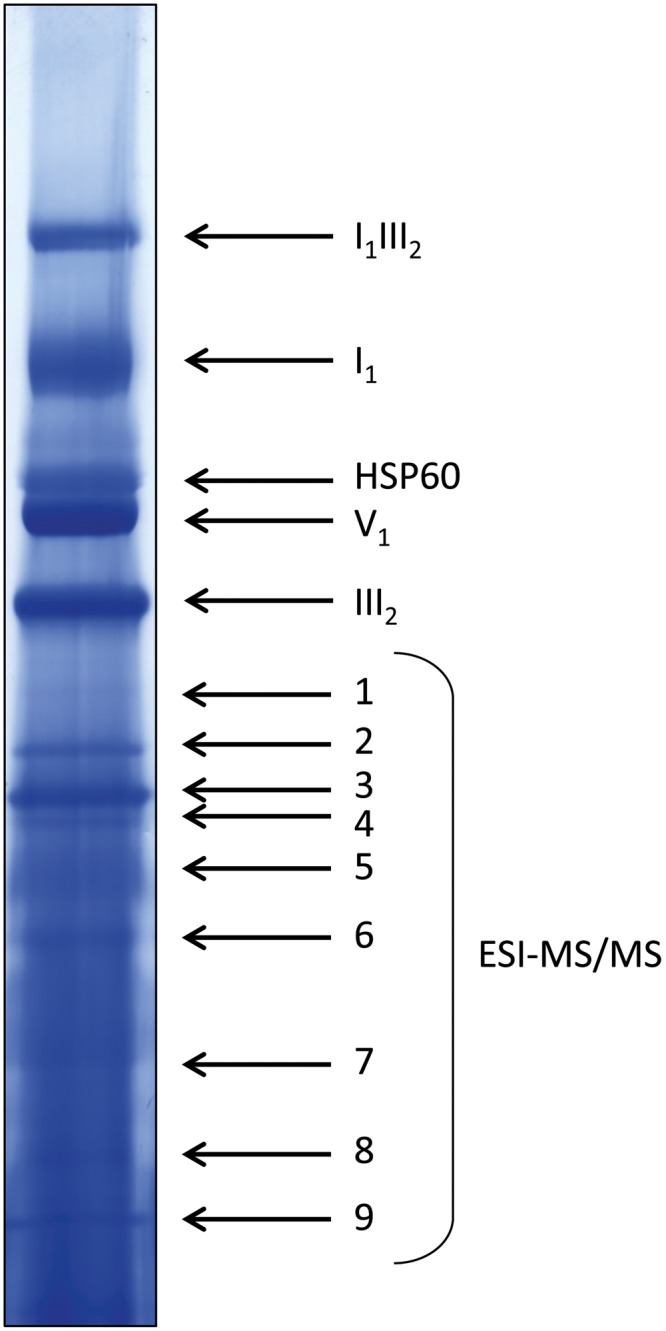
FIGURE 6.

Coomassie-stained WT lane of a representative 1D BN gel for MS analysis. Four hundred micrograms of protein were loaded. Bands in the upper half of the lane were identified by comparison to annotated gel lanes, band 1–9 were analyzed by ESI-MS/MS (see Supplementary Table 1).
