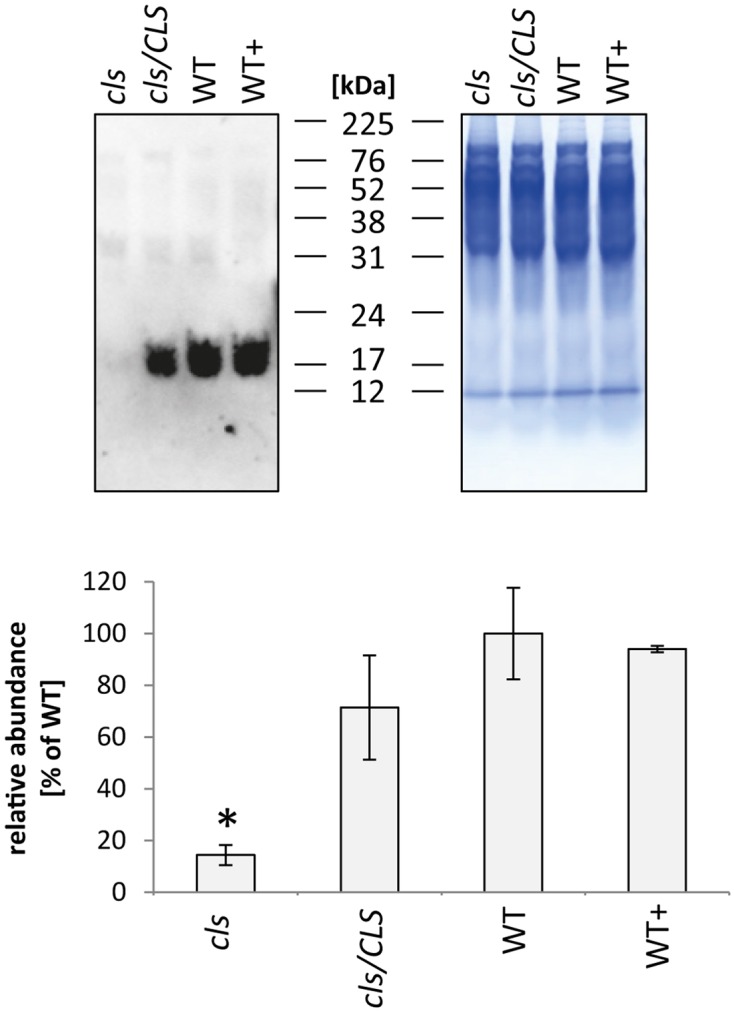
FIGURE 9.

Quantitation of cytochrome c in mitochondria isolated from cls, cls/CLS, WT, and WT+ lines by immunoblotting (top left). Eight micrograms of protein were used of each sample, protein loading was checked by Coomassie stained parallel gel (top right). Quantitation of immune signal (bottom) was achieved by densitometric analyses. Cytochrome c abundances are expressed as arbitrary units of the mean of WT (100%). Error bars show standard error of mean for three biological replicates, asterisk indicates p < 0.05 when compared to WT.
