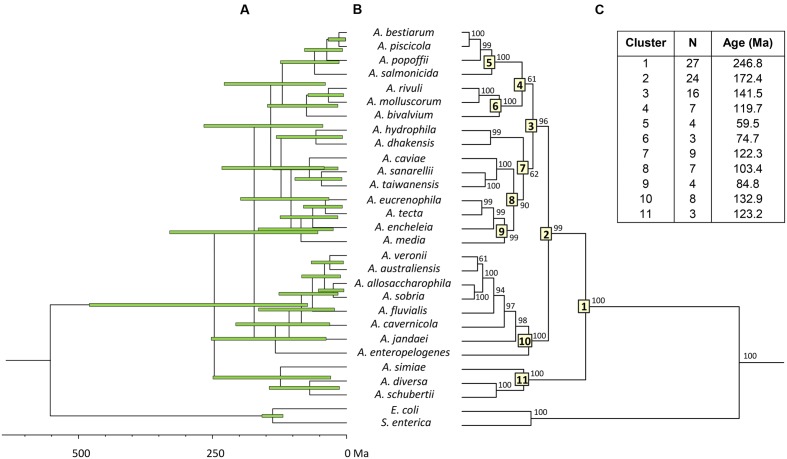
FIGURE 2.
Aeromonas Bayesian consensus tree chronogram. (A) Divergence time estimates for the Aeromonas species. Horizontal bars (green) indicate the 95% highest posterior density (HPD) values. Scale bar at the bottom represents divergence times in millions of years (Ma, Mega annum). (B) Bayesian posterior probability values (>50%) are shown at the nodes. Major Aeromonas species clades are indicated by framed numbers in the corresponding node. (C) Number of species (N), estimated ages for the genus Aeromonas (cluster 1), and the major clades of the chronogram.

