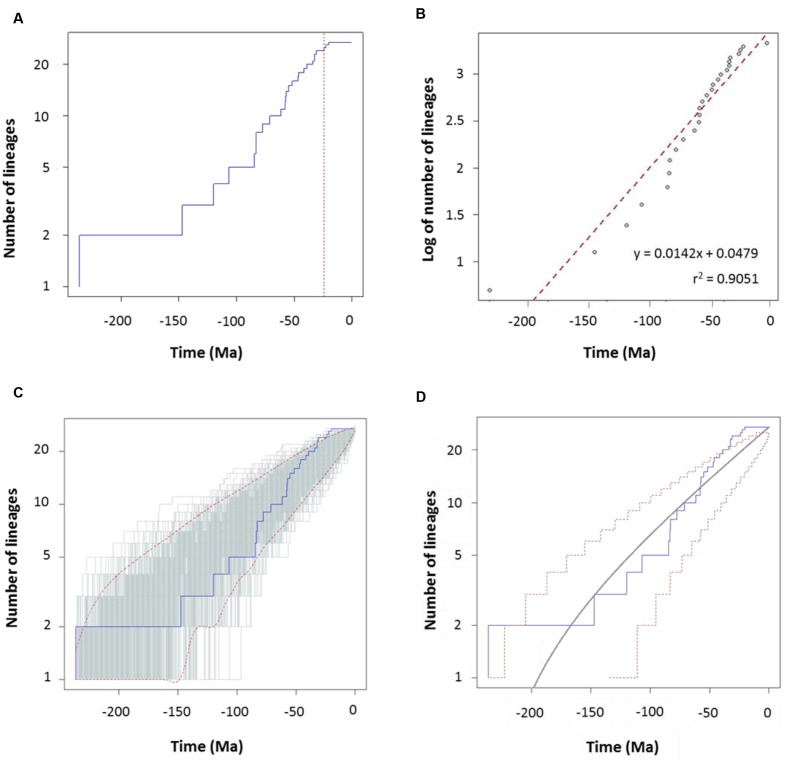
FIGURE 5.
Diversification analysis of the genus Aeromonas using the species tree chronogram. (A) Empirical lineages-through-time (LTT) plot (blue line). Dotted red vertical line indicates the estimated rate shift (24.3 Ma). (B) Linear regression analysis of the LTT curve. Gray dots represent the empirical LTT plot. Red dashed line represents the best-fitting straight line through the points. (C) LTT plots obtained from 1,000 simulated phylogenies (gray lines) under a Yule process, compared with the empirical LTT curve (blue line). Red dashed lines show 95% confidence intervals. (D) Theoretical LTT plot (gray line) obtained with a constant diversification rate (λ = 0.0127) compared with the empirical LTT curve (blue line). Red dashed lines show 95% confidence intervals.

