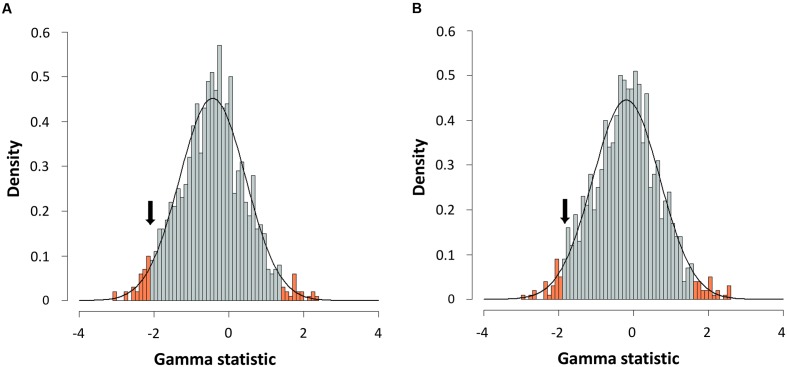
FIGURE 6.
Gamma statistic distribution. Gamma statistic distribution obtained by simulating 1,000 phylogenies under the Yule model using a Bayesian approach from the consensus (A) or the species tree (B). The arrows indicate the empirical gamma value (γ) obtained. Red bars show the 95% limits of distribution.

