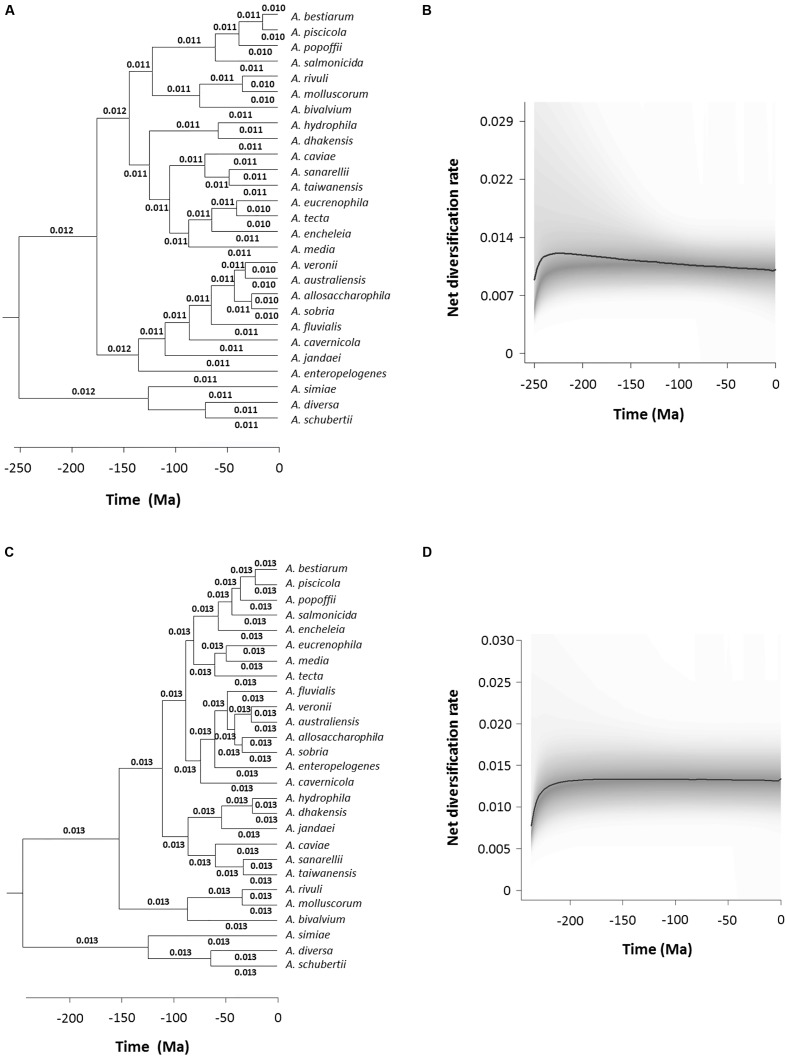
FIGURE 7.
Bayesian Analysis of Macroevolutionary Mixtures (BAMM) analysis. Branch-specific diversification rates estimation based on the consensus (A) and species (C) trees. Net diversification rates-through-time plot for Aeromonas based on the consensus (B) and species (D) trees. Curved black lines represent the median values obtained and the 95% confidence intervals are shadowed in gray.

