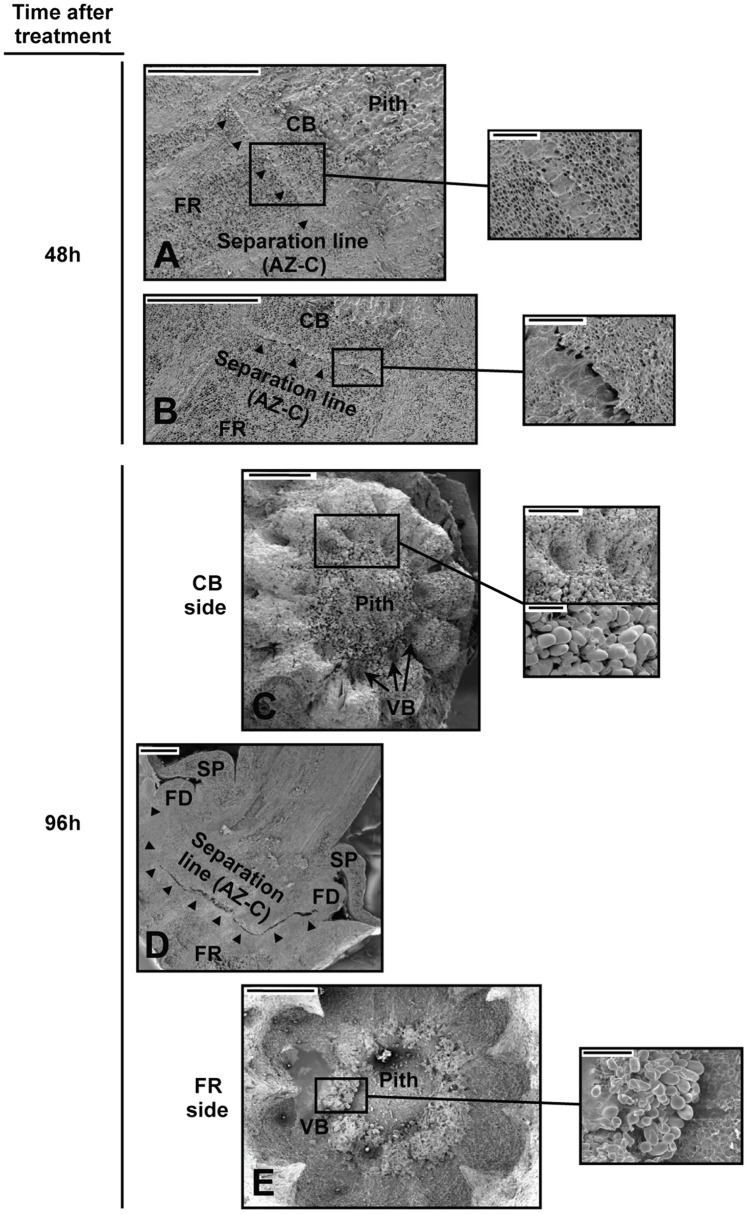
Figure 2.
Cellular morphology of the AZ-C. (A–E) Scanning electron micrographs of longitudinal sections (A,B,D) and the proximal (C; calyx button side) and distal (E; fruit rind side) fracture planes of the AZ-C from Washington Navel fruits after 48 h (A,B) and 96 h (C–E) of ethylene treatment. High magnification pictures show cells of separation layers. AZ-C, abscission zone C;  , separation line inside the AZ-C; CB, calyx button; FD, floral disc; FR, fruit rind; SP, sepal; VB, vascular bundles. Scale bars: 1 mm (A–E), 500 μm (A–C), 200 μm (E), 100 μm (C).

