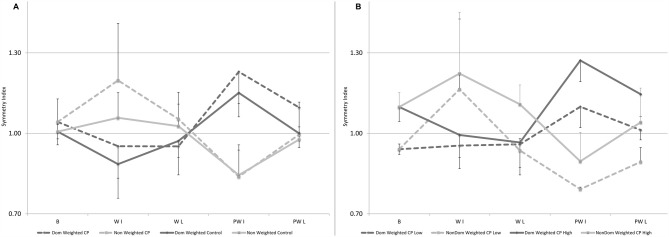
Figure 3.
(A,B) Mean data for Symmetry Index (SI), defined as the ratio of dominant over non-dominant step length, shown here for baseline, and for the first and last five steps in the weighted and post-weight periods in: (A) the control group and the group with CP with the dominant leg weighted condition in black (or black-dotted) and the non-dominant weighted condition in gray (or gray-dotted). Errors bars are shown in one direction to avoid overlap and are directed up for the non-dominant leg and down for the dominant leg; and (B) the two subgroups with CP with the one having SI greater than normal (n = 6) shown by solid lines and the one having SI lower than normal (n = 3) in the dotted lines, with dominant leg weighted conditions in black for the subgroup with the high SI or black-dotted for the subgroup with the low SI and the non-dominant weighted condition in gray for the subgroup with the high SI or gray-dotted for the subgroup with the low SI. Error bars are shown in one direction only, this time by sub-group, with those for the solid lines pointing up and those with the dotted lines pointing down. Some error bars were too small to be visible beyond the data point.

