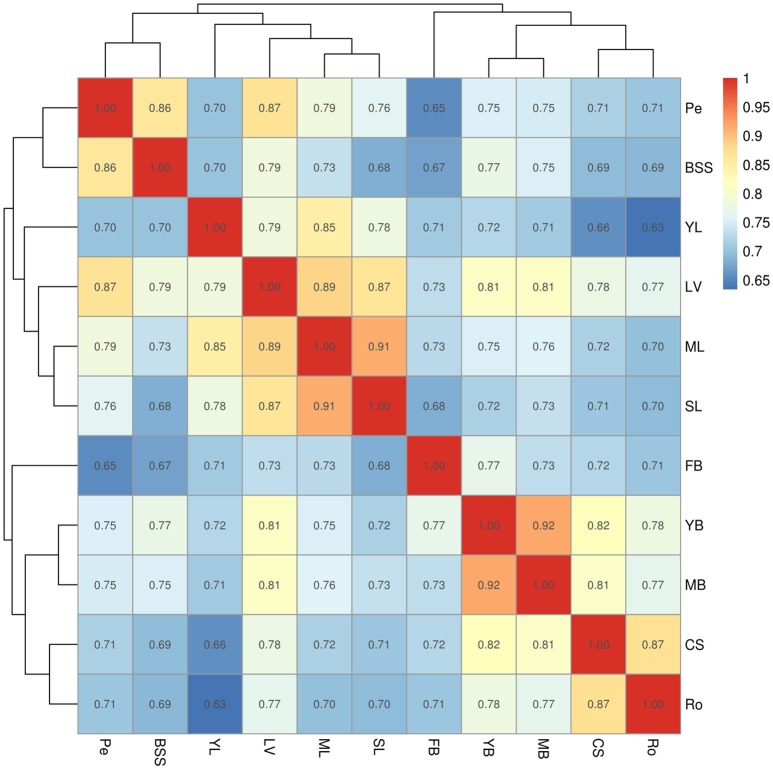
Figure 2.
Hierarchical clustering on pairwise correlation coefficients of unigene expression data from Chinese kale samples. Numbers in the cells represented the spearman's rank correlation coefficient. Sample identifiers: SL, senescent leaf; ML, mature leaf; YL, young leaf; LV, leaf vein; Pe, petiole; YB, young bolting stem flesh; MB, middle bolting stem flesh; BS, bolting stem skin; FB, flower budsl; CS, combining sites; Ro, Roots.

