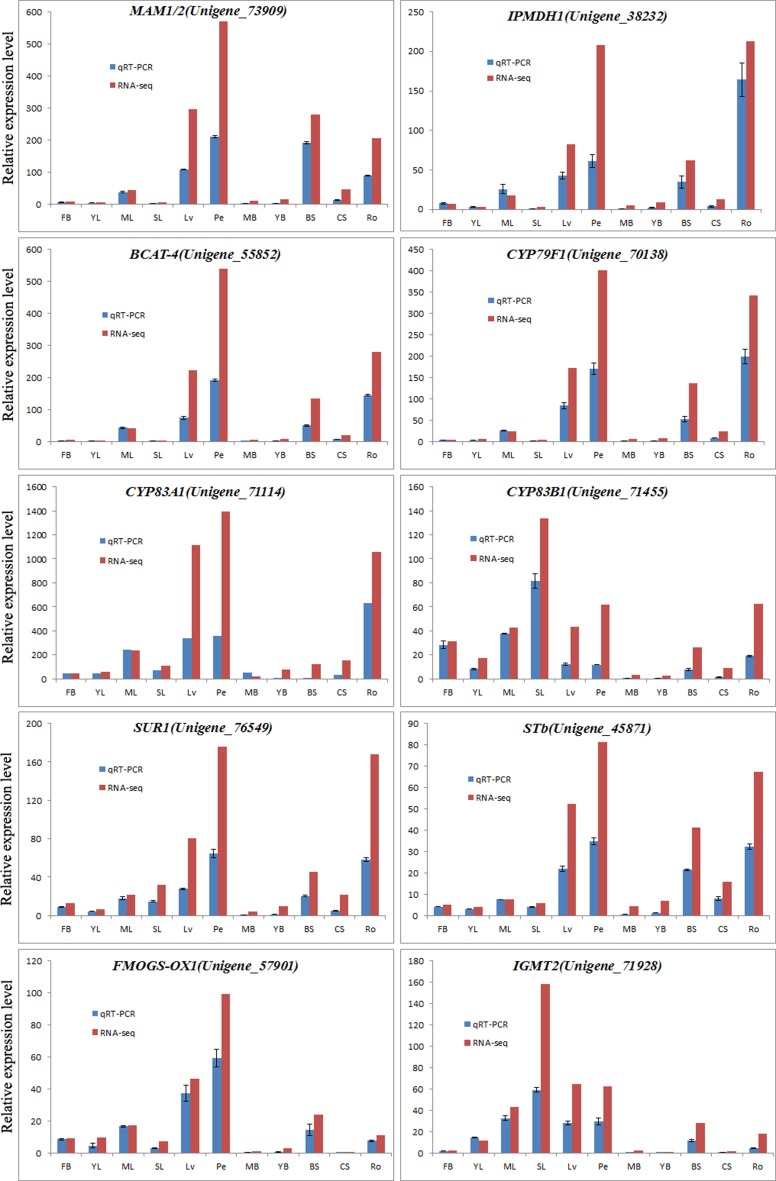
Figure 7.
Expression analysis of glucosinolate biosynthesis-related genes determined by qPCR and RNA-seq. These 10 genes were random selected from the genes annotated by the glucosinolate biosynthetic genes in Arabidopsis (Supplementary Data Sheet 2). The blue and red bars were representing the unigene expression patterns in 11 tissues by qPCR and RNA-seq, respectively.

