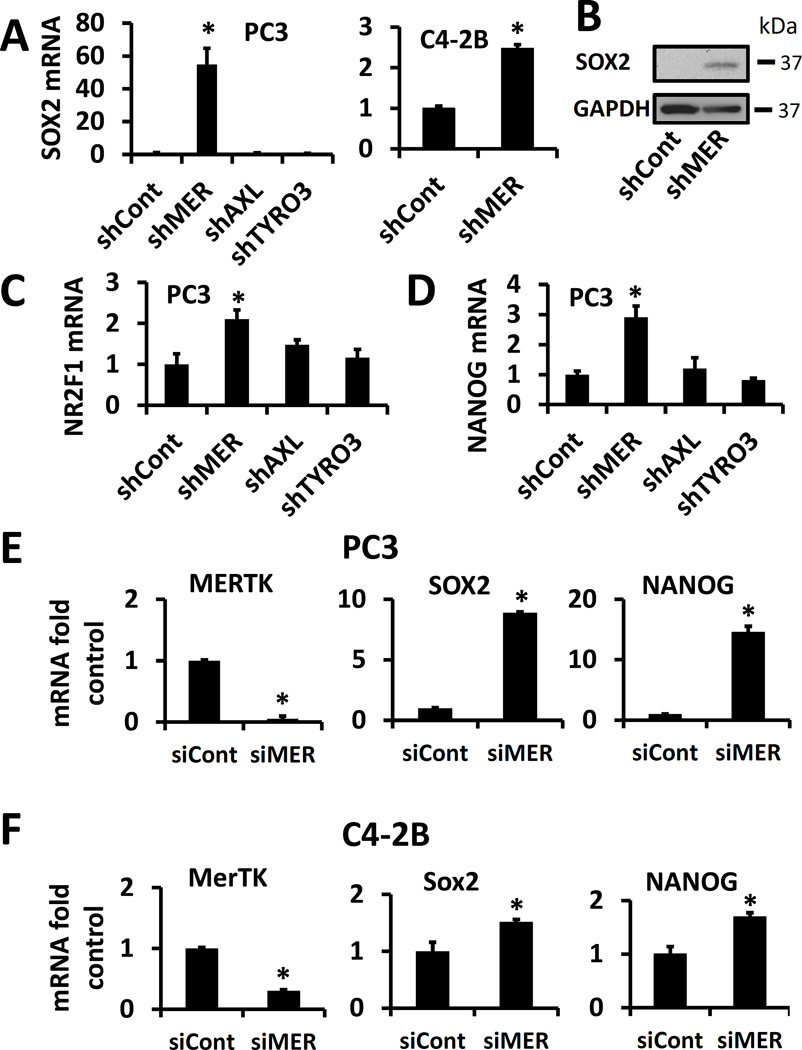
Figure 2.
TAM receptor knockdown and expression of dormancy and pluripotency associated transcription factors. A, PC3 cells with each of the TAM receptors knocked down by shRNA or C4-2B cells with MERTK knocked down, analyzed for SOX2 expression by qPCR. B, Representative SOX2 Western blot of shControl and shMER PC3 cells. C, D, PC3 TAM receptor shRNA cells with expression of NR2F1 or NANOG respectively, quantified by qPCR. E, PC3 cells with MerTK knocked down by siRNA and quantified for expression of SOX2 and NANOG by qPCR. F, C4-2B cells with MERTK knocked down by siRNA and quantified for expression of SOX2 and NANOG by qPCR. All data is presented normalized to control. Error bars represent mean ± SEM. * Represents p < 0.05 compared to shRNA or siRNA control cells.

