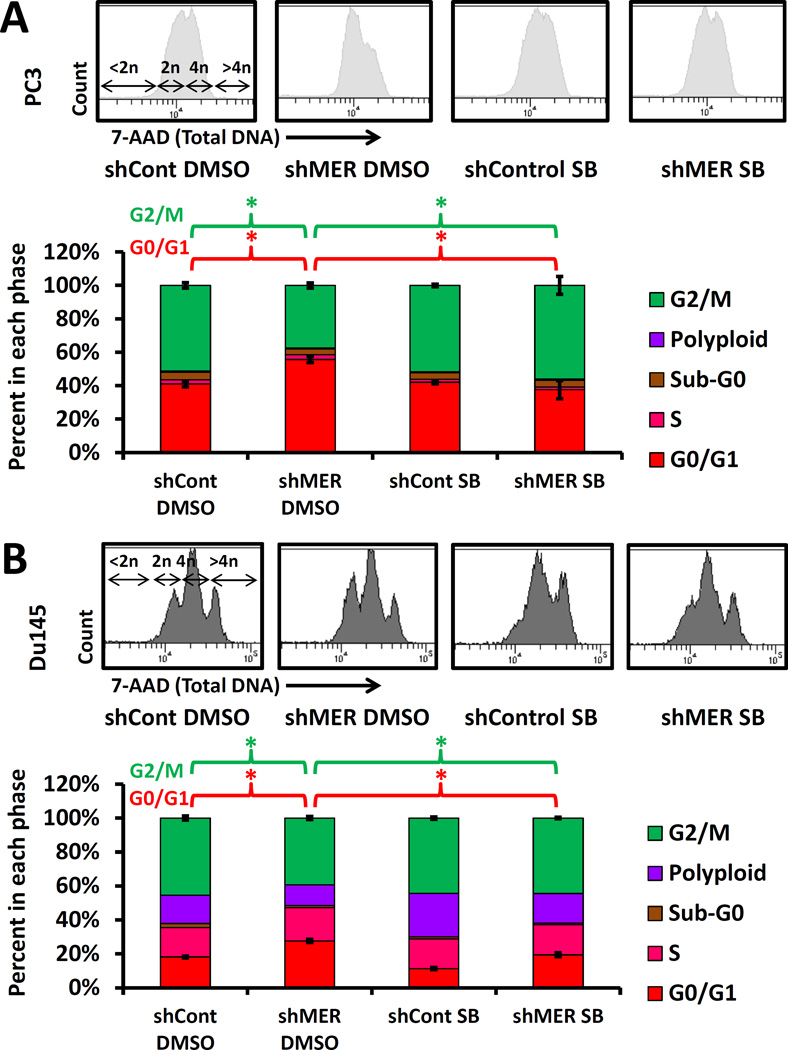
Figure 6.
Reversal of the shMER cell cycle phenotype with long term p38 inhibition. A, Control or shMER PC3 cells cultured with 5 µM SB203580 or 0.05% DMSO solvent control for 14 days in 10% serum and 3 days in 0.1% serum followed by cell cycle analysis with total DNA and BrdU labeling as described for figure 3. Top: Total DNA flow cytometry histograms. Bottom: quantified data. Error bars are shown for the G0G1 and G2M populations and represent mean ± SEM. * Represents p < 0.05 for comparisons of interest. B, Cell cycle analysis as above of Du145 cells grown for 17 days in 10% serum with or without SB203580.

