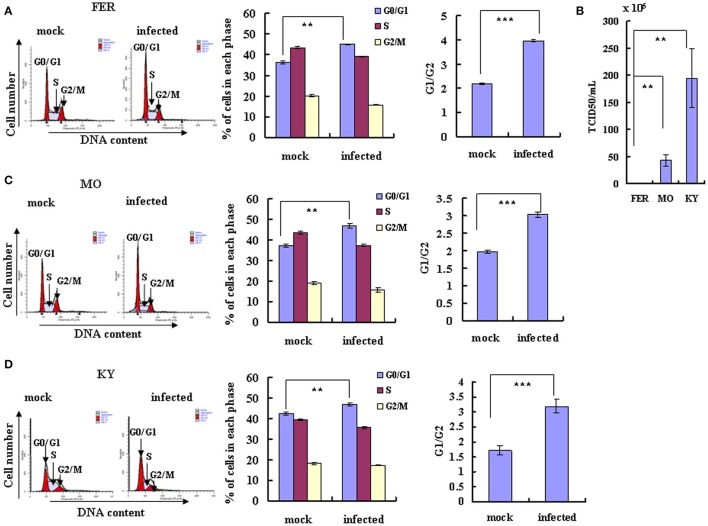
Figure 2.
EV-D68 infection induces G0/G1 arrest. (A,C,D) RD cells were infected with EV-D68 Fermon (A), US/MO/14-18947 (C) or US/KY/14-18953 (D) at an MOI of 0.8 or mock for 24 h for analysis of cell cycle status. Left: Cell-cycle profiles were determined by flow cytometry. Middle: The histograms show the percentage of cells in each phase of the cell cycle in mock-infected and EV-D68-infected cells. Right: The ratio of G0/G1 to G2/M is shown. (B) The virulence of Fermon, US/KY/14-18953 and US/MO/14-18947strains in infected RD cells was assessed 24 h post-infection with virus at MOI 0.8. Values are expressed as the TCID50/mL of the progeny viruses in the supernatant. The results represent the mean ± S.D of three independent experiments. **P < 0.01 and ***P < 0.001.

