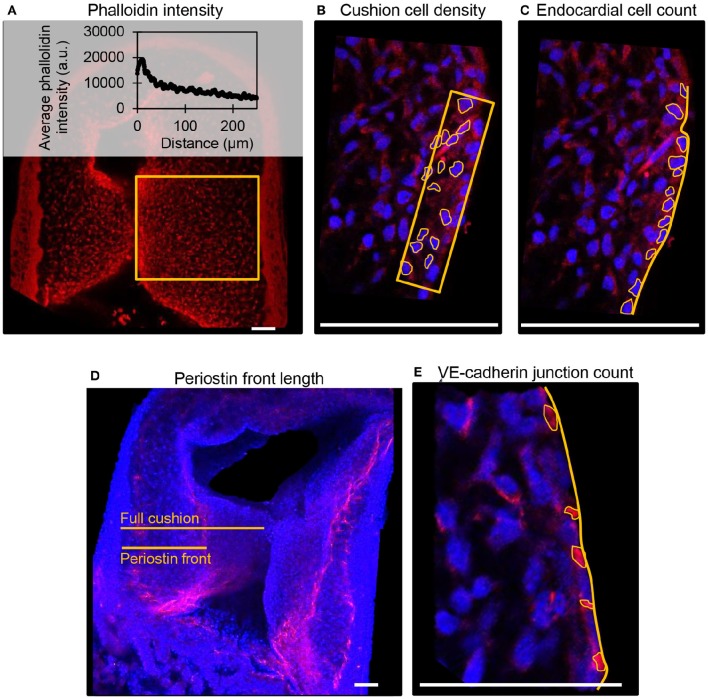
Figure 2.
Example confocal fluorescent image quantifications from control embryos. (A) Phalloidin (red) stain fluorescence intensities from a full cushion, where the average fluorescent intensity at each distance position across the cushion is plotted. (B) Cushion cell density measured from the number of outlined DAPI-stained nuclei (blue) within an area 10 μm into the cushion from the lumen edge. (C) Cell count per endocardium length measured from the number of outlined DAPI-stained nuclei (blue) along with a measured length of the endocardium. (D) Periostin (red) front length measured as a percentage of the length of the full cushion. (E). VE-cadherin (red) junction per endocardium length measured from the number of outlined junctions along a measured length of the endocardium. Scale bar = 50 microns.

