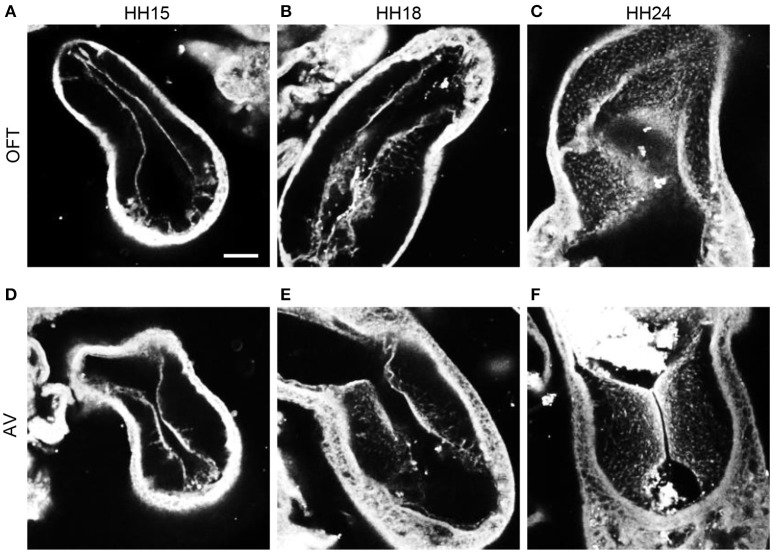
Figure 3.
Phalloidin confocal fluorescent image analysis. Confocal fluorescent images at 20x from whole embryo hearts stained with phalloidin at HH15 (A,D), HH18 (B,E), and HH24 (C,F) at the outflow tract cushions (A–C) and the atrioventricular cushions (D–F). Scale bar = 100 microns. AV, atrioventricular canal; OFT, outflow tract.

