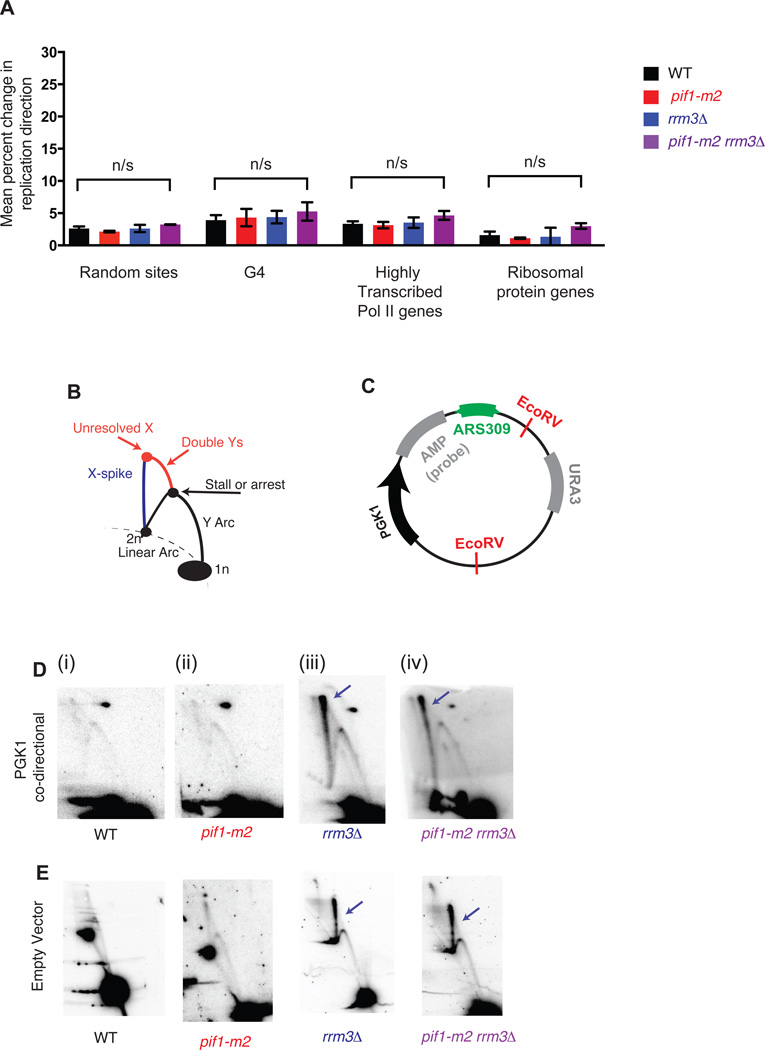
Figure 4. G-quadruplexes and highly transcribed RNA Polymerase II genes do not contribute to significant replication fork stalling or arrest genome wide.
(A) Grand mean ± SD from three independent experiments of the change in replication direction, interpreted as replisome stalling or arrest, around random sites (n=292), G-quadruplexes (n=154), highly transcribed RNA Pol II genes (n=172) and ribosomal protein genes (n=56) as in Fig. 2E. Loci were filtered as for the tDNA analysis in Fig. 2D–F, excluding sites within ±5 kb of a sequence gap, replication origin, or tDNA. Significance was determined by Monte Carlo resampling; *** indicates a p<0.0001; n/s indicates p>0.05. (B) Schematic of intermediates, resolved in a neutral-neutral 2-dimensional agarose gel, resulting from the replication of plasmid (C) in asynchronous cultures. (D–E) Neutral-neutral 2-Dimensional gel analysis of a plasmid with or without a PGK1 insert in asynchronous WT, pif1-m2, rrm3Δ or pif1-m2 rrm3Δ, as indicated. 2D gel signals consistent with changes in replication fork mobility or resolution are indicated in colors corresponding to the schematic in Fig. 3A. Plasmids were cut with the indicated restriction enzymes and crosslinked with psoralen prior to electrophoresis. The spot on the upper right in (D) is due to background hybridization of the probe.

