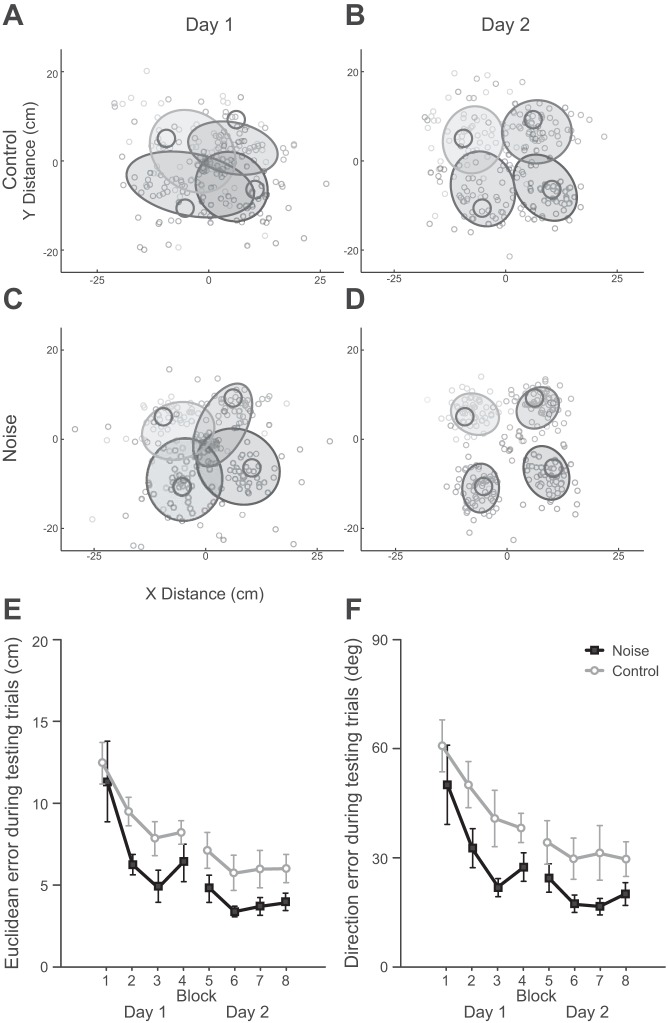
Fig. 5.
Feedforward task performance. A–D: distributions of final positions are shown for subjects in the noise group (C and D) and control participants (A and B) for the first day (blocks 1–4, A and C) and the second day (blocks 5–8, B and D). Each shade of gray represents 1 of the 4 targets, and the dark circles indicate the actual target locations. The ellipses are 75% confidence ellipses for the final positions for each target across all subjects. E: participants in both groups showed a significant decrease in Euclidean error during testing from the first block to the final block (P < 0.001). However, participants experiencing signal-dependent noise had significantly lower Euclidean errors than the control group (P = 0.036) across all testing blocks. F: similarly, both groups reduced direction error from the first to the final block (P < 0.001), but subjects in the noise group had significantly lower direction errors overall (P = 0.023). Error bars represent 1 SE.

