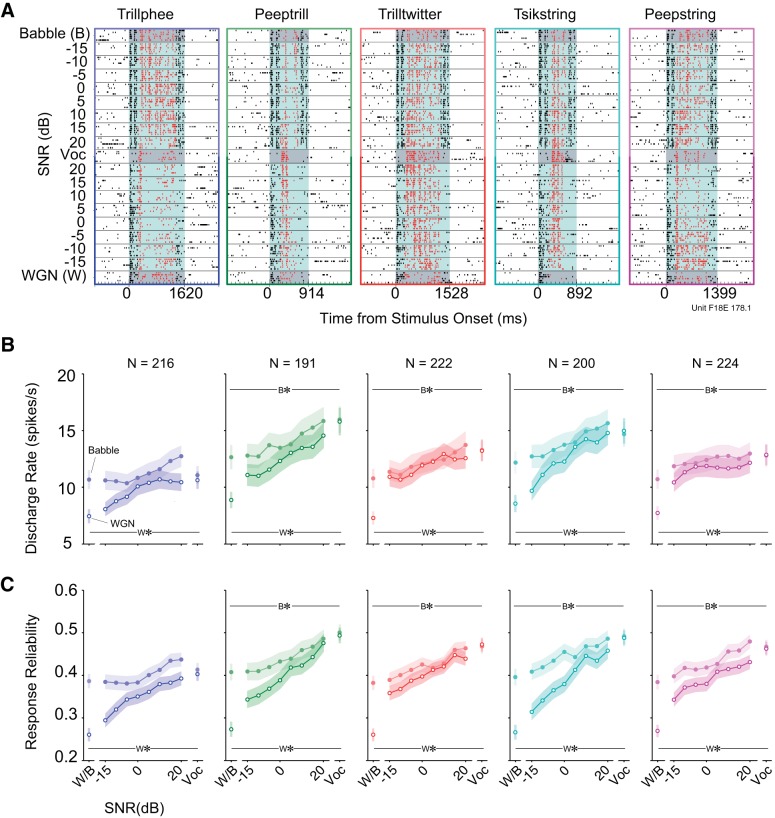
Fig. 2.
Clean vocalizations generally elicit the most spiking and the most reliable spiking. A: example spike raster plots of 1 unit's responses to 5 noisy vocalizations under 2 different noise conditions. Each point denotes an action potential generated by this unit. Black dots with white background are the neural activities in silence. Black dots with light-blue background are neural activities occurring during 2 concatenated noise presentations. Red dots with light-blue background are spikes driven by noisy vocalizations. Responses to vocalizations and noises alone are highlighted with dark-gray background for distinction. B: mean discharge rates to 5 vocalizations at multiple SNRs (means ± SE). Lines with filled circles are discharge rates of vocalizations in Babble. Lines with open circles are discharge rates of vocalizations in WGN. W*/B* indicates mean discharge rate to WGN/Babble (W/B; respectively) alone is significantly lower than vocalization alone (see text). C: mean response reliabilities to 5 vocalizations at multiple SNRs (means ± SE). The same color and line type denotations as in B are depicted. W*/B* indicates mean response reliability to WGN/Babble (W/B; respectively) alone is significantly lower than vocalization alone (see text).

