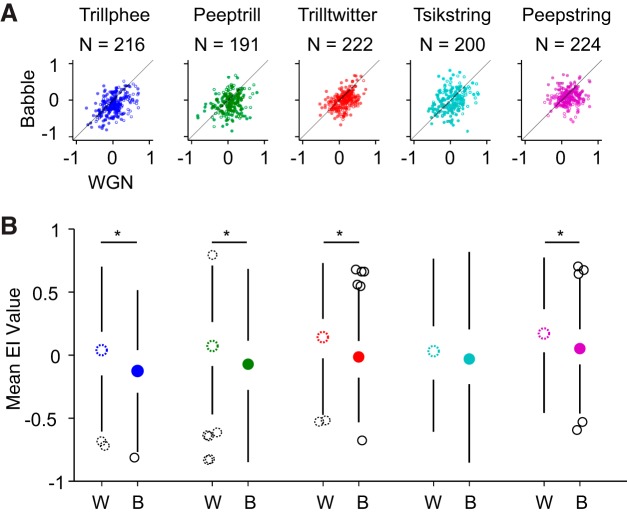
Fig. 3.
Babble tends to disrupt vocalization encoding more than WGN. A: scatterplot of mean of EI profile values under WGN and Babble conditions. Neuron counts are indicated above each plot. Filled dots and open dots indicate data from 2 monkeys. B: boxplots of EI profile mean values under WGN (W) and Babble (B) conditions. Neuron counts are the same as in A. Boxplots with dotted, open circles display distribution of mean EI values under WGN condition, and boxplots with filled circles display distribution of mean EI values with background of Babble noise. Open, black circles and dotted, open, black circles denote outliers. *Mean EI values under WGN and Babble are significantly different (see text).

